Unit Economics
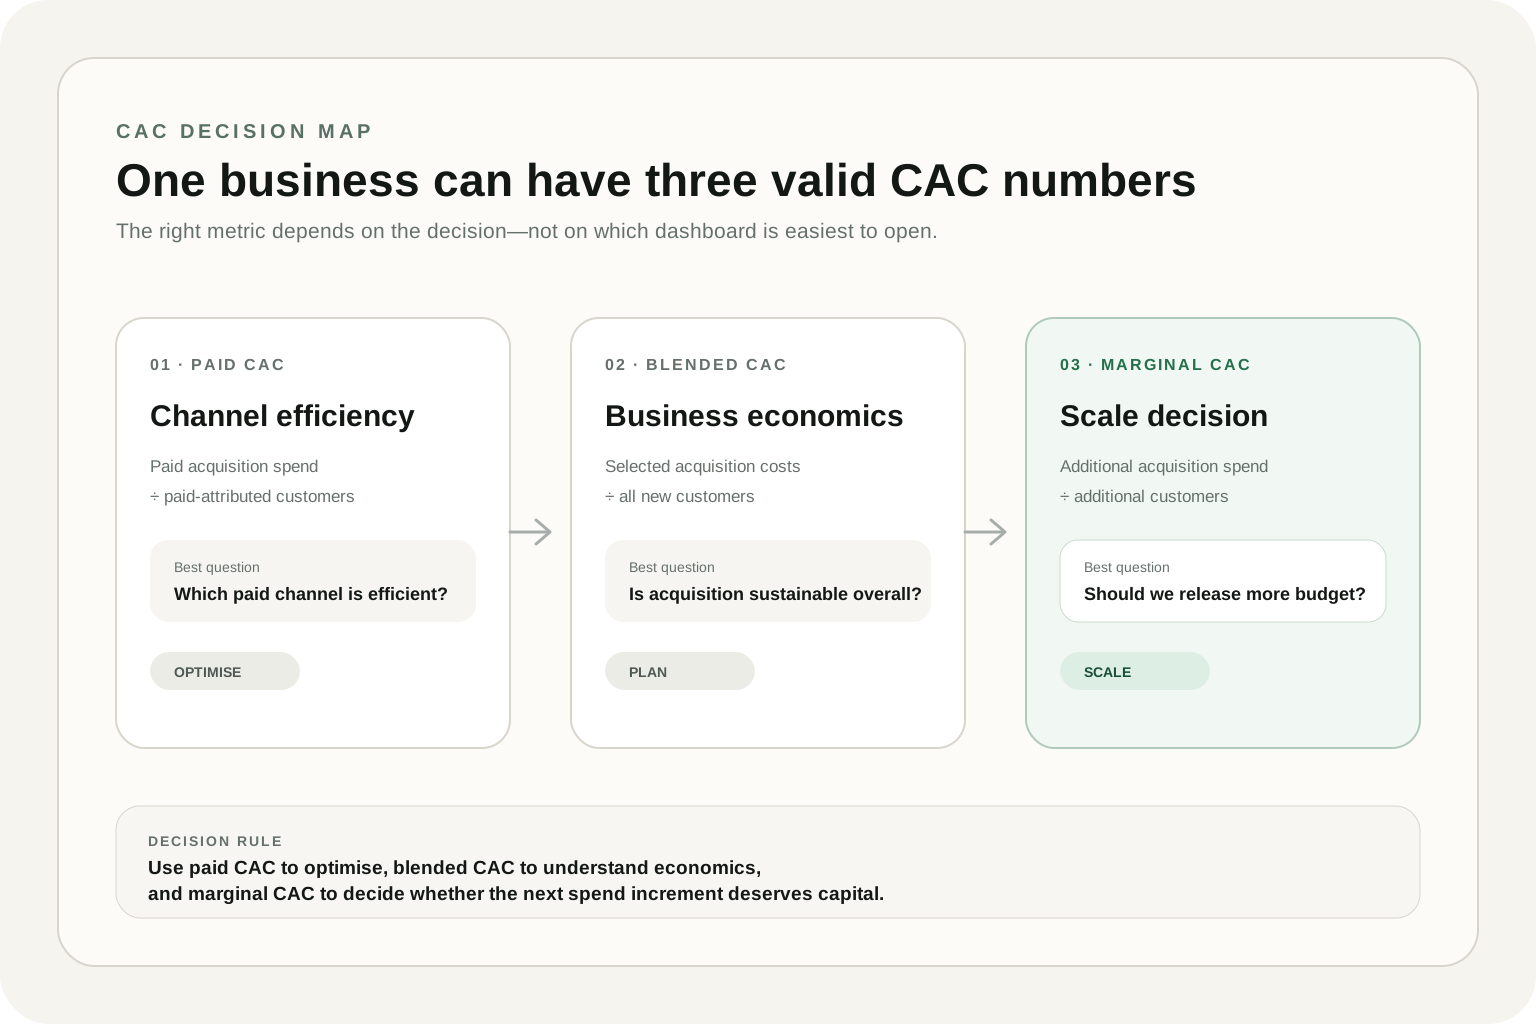
Blended CAC vs Paid CAC vs Marginal CAC: Which One Should You Use?
A practical guide to choosing the right CAC metric for paid-channel optimisation, company-level unit economics and marketing scaling decisions.
Read articleShare
A commercial framework for forecasting CAC at higher spend and deciding how much additional marketing budget to release — without treating the historical average as a promise.
A business spends $50,000 per month on acquisition, pays $500 for a new customer and wants to grow revenue by 30%. The tempting forecast is simple: increase spend by 30%, acquire 30% more customers and keep CAC at $500.
That forecast may be directionally useful at the current operating range. It becomes risky when it treats the cost of the next customer as identical to the average cost of every customer acquired so far.
Founders, CMOs and Heads of Growth therefore need to answer a narrower and more commercial question:
If marketing spend increases, what CAC should we expect from the next budget tranche — and how much capital should we release before validating it?
This guide explains why CAC can increase when marketing spend scales, how to forecast CAC at higher ad spend and how to turn Conservative, Base and Upside scenarios into a controlled budget-release decision.
More spend does not mechanically cause higher CAC in every business. CAC may remain stable or improve when better creative, a stronger offer, higher conversion, faster sales follow-up, improved pricing or a more productive channel offsets the cost of expansion.
But additional budget often reaches customers under different conditions: weaker intent, higher auction prices, new geographies, broader audiences, less proven channels or a sales and fulfilment system operating closer to capacity. That creates scaling risk even when the current average looks good.
A defensible forecast should therefore:
A flat-CAC model assumes every additional dollar buys customers at the same rate as the current budget. If $50,000 acquired 100 customers, the model assumes $75,000 will acquire 150.
The arithmetic is transparent. The hidden assumption is not. It implies that demand, channel capacity, conversion, customer quality and operating response remain unchanged across the larger spend range.
That assumption becomes weaker when:
Flat CAC is not always wrong. It is a baseline case that should earn less weight as the forecast moves farther beyond observed evidence.
The existing marketing budget for a revenue target framework owns the total-budget question: how much investment may be required to reach a target. This article owns the next-release question: how much of that forecast should be approved before the scaling assumptions are validated.
Average or blended CAC divides the selected acquisition spend by all new customers acquired in the same period. It is useful for understanding the economics of the existing budget.
Average CAC = total acquisition spend ÷ total new customers
Marginal CAC isolates the change between two spend levels:
Marginal CAC = additional acquisition spend ÷ additional customers acquired
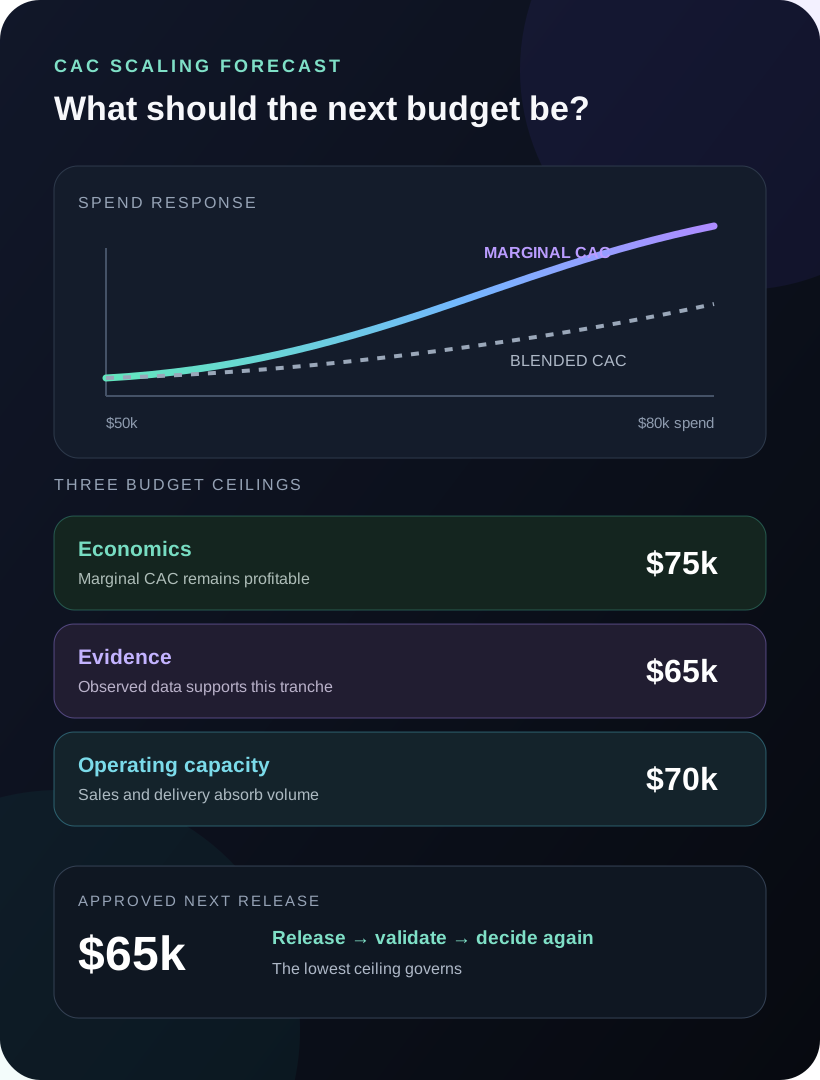
Suppose monthly spend increases from $60,000 to $70,000 and customers increase from 117.5 to 133.2. The newest $10,000 acquired approximately 15.7 customers, producing a marginal CAC of about $636. The blended CAC at the new level is only about $525 because cheaper customers acquired by the earlier spend remain inside the average.
The historical average absorbs cheaper earlier customers. Marginal CAC isolates the newest spend increment and is the more relevant signal for the next budget decision.
Marginal
$500
$50k
Marginal
$571
$60k
Marginal
$636
$70k
Marginal
$727
$80k
Monthly acquisition spend →
Blended CAC at $80k
$556
Marginal CAC of newest tranche
$727
Approving another increase from the $556 average hides the economics of the customers that additional capital must acquire.
This difference explains why a company can report an acceptable account-wide CAC while the newest budget increment is already below the required return. Budget approval should see both numbers.
Marginal CAC is easiest to interpret when spend changes in controlled stages and the customer definition remains stable. If channel mix, offer, season or tracking also changes, the number becomes a diagnostic signal rather than a clean causal estimate.
Rising CAC is not one problem. It is an outcome that can be produced by several constraints. The remedy depends on which constraint is active.
| Possible driver | What changes | Evidence to inspect | Likely response |
|---|---|---|---|
| Audience saturation | Additional impressions reach lower-intent or repeatedly exposed users | Reach, frequency, new-customer rate and segment CAC | Expand creative, audience or channel deliberately |
| Auction pressure | Media cost rises even when conversion quality is unchanged | CPM, CPC, impression share and competitor timing | Reforecast bids, timing and achievable volume |
| Creative or offer fatigue | Engagement and conversion weaken at higher exposure | Creative-level conversion, frequency and cohort quality | Refresh the offer and test before releasing more spend |
| Channel or product mix | The next customers come from a structurally different source or product | CAC, margin and retention by channel, product and cohort | Model separate economics instead of one blended curve |
| Funnel capacity | Lead response, sales conversion, inventory or onboarding deteriorates | Stage conversion, response time, backlog and cancellation rate | Fix the downstream constraint before buying more demand |
| Measurement change | Spend and customers are counted differently across periods | Attribution, consent, CRM matching, refunds and event changes | Reconcile definitions before interpreting the trend |
CAC may also improve during scale. A higher budget can provide more data for optimisation, fund better creative, unlock stronger placements or support a funnel improvement that raises conversion. The forecast should represent this as an Upside case, not as the only approved assumption.
The objective is not to predict one exact CAC. It is to make the decision sensitive to a reasonable range of acquisition outcomes.
Use the latest completed month or a stable recent window. Confirm that spend, customer count and revenue per acquired customer use the same scope and definition. Separate extraordinary promotions or outages rather than treating them as the normal run rate.
Forecast at one common budget so every scenario answers the same question. Comparing a Conservative outcome at $80,000 with an Upside outcome at $100,000 confuses assumption risk with budget size.
The scenarios are not probabilities or guarantees. They are stress cases used to expose how much the decision depends on acquisition efficiency.
For each forecast CAC:
Expected customers = proposed acquisition spend ÷ forecast CAC
Expected acquired-customer revenue = expected customers × comparable revenue per customer
A scenario can reach the revenue target and still be unacceptable if marginal CAC exceeds the profitable ceiling, payback becomes too slow or the business cannot serve the additional customers.
Consider a business with the following completed-month baseline:
The team creates three CAC scenarios at the same $65,000 budget:
| Scenario | Forecast CAC | Expected customers | Expected revenue | Decision implication |
|---|---|---|---|---|
| Conservative | $575 | 113.0 | $226.1k | Only 13 incremental customers; validate margin and marginal CAC tightly |
| Base | $535 | 121.5 | $243.0k | The proposed tranche creates useful growth with moderate deterioration |
| Upside | $490 | 132.7 | $265.3k | Execution improvement creates headroom but should not fund the plan alone |
The Base case moves blended CAC from $500 to $535. But the $15,000 increase generates about 21.5 incremental customers, which implies a marginal CAC near $698. The blended number is still attractive because the original 100 customers were acquired at the lower baseline cost.
If the approved maximum profitable CAC is $720, the Base marginal case has limited headroom. The decision should be a $15,000 staged release with a predefined stop condition — not immediate approval of the full annual growth budget.
Use the Marketing Budget Calculator & Growth Planner to compare a risk-adjusted budget range without extending the latest CAC as a guaranteed constant.
A forecast can identify a plausible budget range. Releasing capital requires a second decision: how much of that range is supported now?
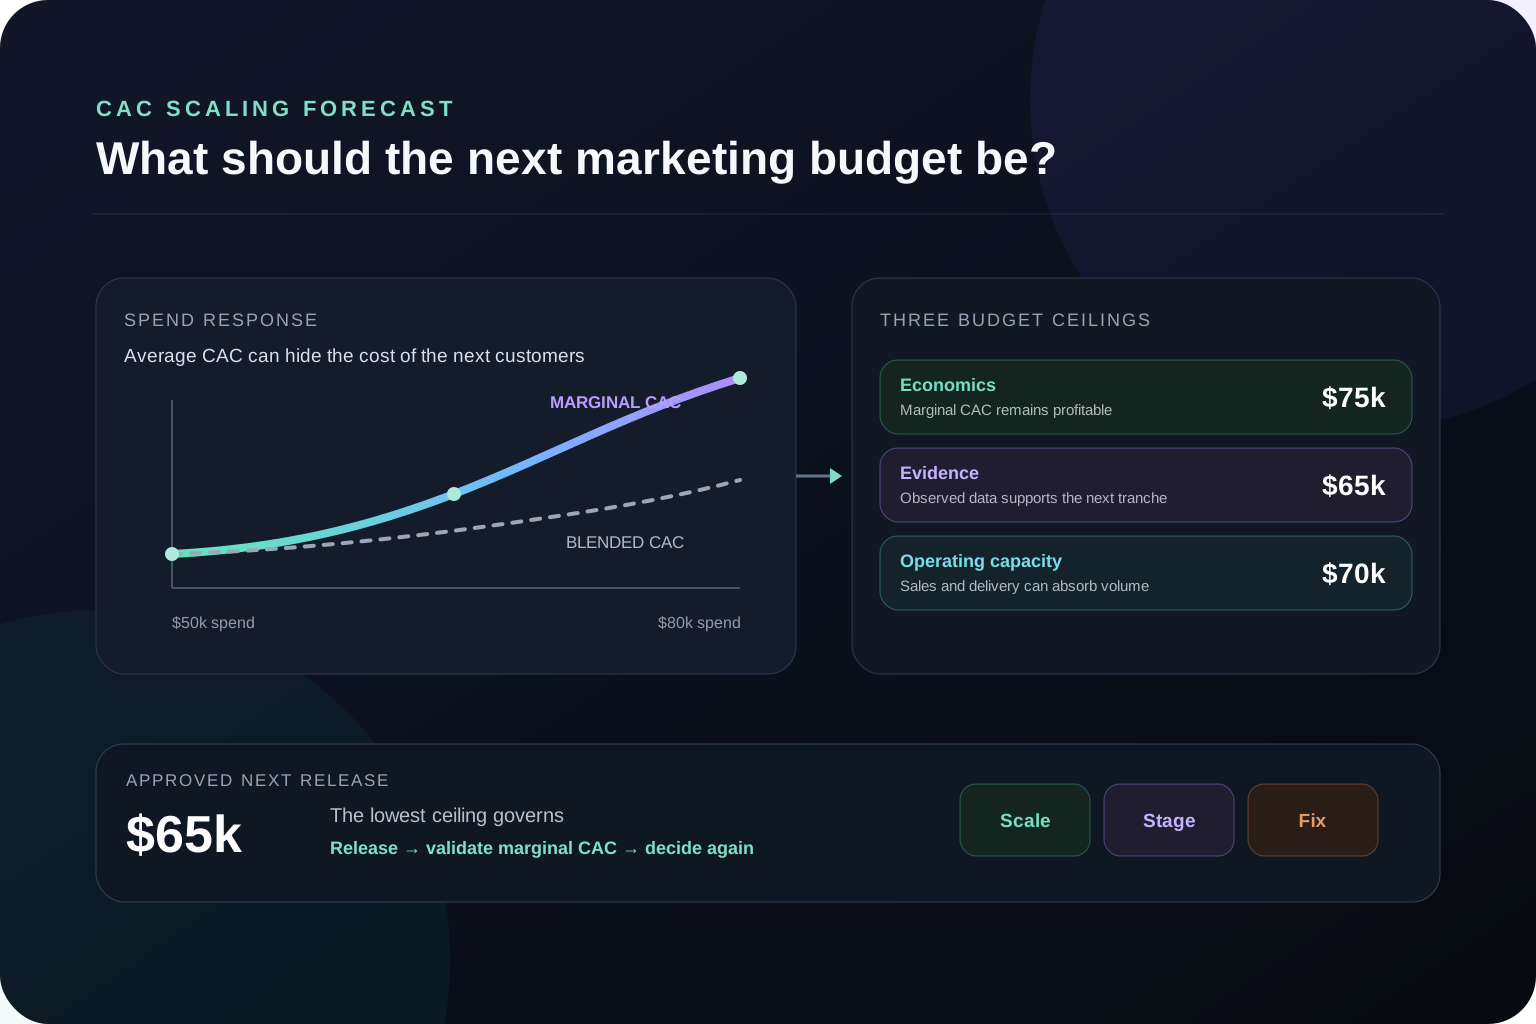
The next budget should satisfy three ceilings:
The spend level at which expected marginal CAC, contribution, ROAS and payback still meet the business requirement. This ceiling protects value.
The spend level that can be justified without extrapolating too far beyond observed history, validated experiments or comparable channel evidence. This ceiling protects decision quality.
The spend level whose customer volume the business can finance, sell, fulfil, onboard and retain without degrading the outcome. This ceiling protects execution.
Approved next budget = minimum of the economics, evidence and operating ceilings
A financially attractive forecast is not enough when the evidence or operating system cannot support the same increase. The lowest ceiling governs the next tranche.
Economics ceiling
$75k
Marginal CAC must remain below the profitable acquisition boundary.
Evidence ceiling
$65k
Only a $15k increase is supported before the plan moves too far beyond observed spend.
Operating ceiling
$70k
Sales, fulfilment, onboarding and cash can absorb this customer volume.
Approved next budget
Minimum of economics, evidence and operating ceilings
$65k
The lowest ceiling is not a permanent company-wide budget cap. It is the current release boundary. New evidence, better economics or added operating capacity can move it.
The maximum profitable CAC framework provides the customer-level economic boundary. The profitable ROAS framework adds the revenue-efficiency threshold. This model uses those boundaries to control the timing and size of the next budget release.
There is no universal safe percentage. A 10% increase may be too aggressive for a small, saturated audience and unnecessarily cautious for a broad, underfunded channel with strong evidence.
A useful tranche should be:
The correct increase is therefore derived from the decision window, expected customer volume and downside tolerance — not copied from a platform rule.
When the proposed improvement depends on a new landing page or conversion rate, calculate whether the business has enough eligible traffic to validate it. The A/B test sample-size framework helps separate a testable conversion assumption from one that cannot produce decision-grade evidence in time.
Approving a tranche without defining the next decision simply delays the argument. Before spend increases, document:
Avoid reacting to every daily fluctuation. Evaluate over a window appropriate to conversion volume and the sales cycle, while keeping an emergency stop for clear tracking failures, severe value destruction or operational breakdown.
A good stop-loss does not mean “pause whenever CAC rises.” It distinguishes acceptable learning cost from a persistent breach of the approved economic or customer-quality boundary.
Scale when the newest tranche remains inside all three ceilings, marginal CAC meets the required economics and customer quality does not deteriorate. Approve another defined tranche rather than converting one successful stage into unlimited budget authority.
Stage when the forecast is attractive but the next spend level lies beyond strong historical support. Release enough capital to buy evidence, then update the scenarios from completed observations.
Fix before scaling when creative, conversion, sales response, attribution, margin or delivery capacity is the active constraint. More demand rarely repairs a downstream system that cannot convert or fulfil it.
Hold when the Conservative case breaches the economic boundary, the input definitions cannot be reconciled or the operating system cannot support the expected volume. Holding protects capital until the limiting ceiling moves.
A budget forecast cannot repair inconsistent measurement. Verify that:
If Google Ads and GA4 disagree, use the conversion reconciliation decision tree before interpreting a CAC movement as a real efficiency change.
When the issue extends across acquisition identity, CRM outcomes, offline revenue and customer cohorts, the Analytics Infrastructure service addresses the system required to connect spend with commercial outcomes.
A self-service scenario is appropriate when definitions are stable, the next increase is close to observed spend and one owner can monitor the validation rules.
Specialist support becomes more valuable when:
Use the Predictive LTV & Payback tool when customer value and cash recovery constrain the release. Review Unit Economics & Growth Strategy when the business needs one investment model across CAC, LTV, contribution, payback and budget scenarios.
A Growth Audit is the stronger path when measurement, funnel performance and the quality of the overall growth plan need independent review. The Mental Health Marketing Analytics case study shows why acquisition performance becomes more actionable when it is evaluated beside activation, retention and customer value.
Additional spend may reach more expensive auctions, broader or lower-intent audiences and less proven channels. CAC can also rise when creative, conversion, sales or fulfilment capacity deteriorates. It does not always increase, so diagnose the driver instead of assuming spend alone caused it.
Preserve a comparable baseline, choose one proposed budget, build Conservative, Base and Upside CAC assumptions, then calculate customer and revenue outcomes at that same spend level. Compare each outcome with profitable CAC, payback and capacity boundaries.
Average CAC divides all acquisition spend by all new customers. Marginal CAC divides the additional spend between two levels by the additional customers acquired. Marginal CAC is more relevant for deciding whether the next budget tranche should be approved.
Increase it by a tranche large enough to generate useful evidence but small enough to reverse if marginal economics fail. The amount should remain below the economics, evidence and operating ceilings rather than follow a universal percentage.
Stable CAC may be possible when stronger creative, conversion, pricing, channel expansion or sales execution offsets scaling pressure. Treat stable CAC as a scenario to validate, not a guaranteed outcome. Monitor marginal CAC and customer quality as each tranche is released.
Update it after each completed validation window and after material changes in channel mix, offer, conversion, attribution, pricing, sales capacity or customer value. Avoid rebuilding a strategic forecast from incomplete daily volatility unless an emergency boundary has been breached.
The most defensible marketing budget is not the one built from the cleanest historical average. It is the one that remains useful when acquisition efficiency, customer mix or operating conditions change.
Start with the completed baseline. Separate average from marginal CAC. Build several outcomes at one proposed spend level. Then release only the amount supported by economics, evidence and operating capacity.
That process turns “How much should we increase the budget?” from a generic percentage into a measurable capital-allocation decision.
Ready to build the scenarios? Forecast a risk-adjusted marketing budget range.
Need to connect the forecast to margin, customer value and implementation? Discuss the budget decision or explore Unit Economics & Growth Strategy.
Share this article
Next step
Use your latest completed month to compare Conservative, Base and Upside outcomes, then release the next tranche against explicit evidence and stop conditions.
Related
A practical guide to choosing the right CAC metric for paid-channel optimisation, company-level unit economics and marketing scaling decisions.
Read article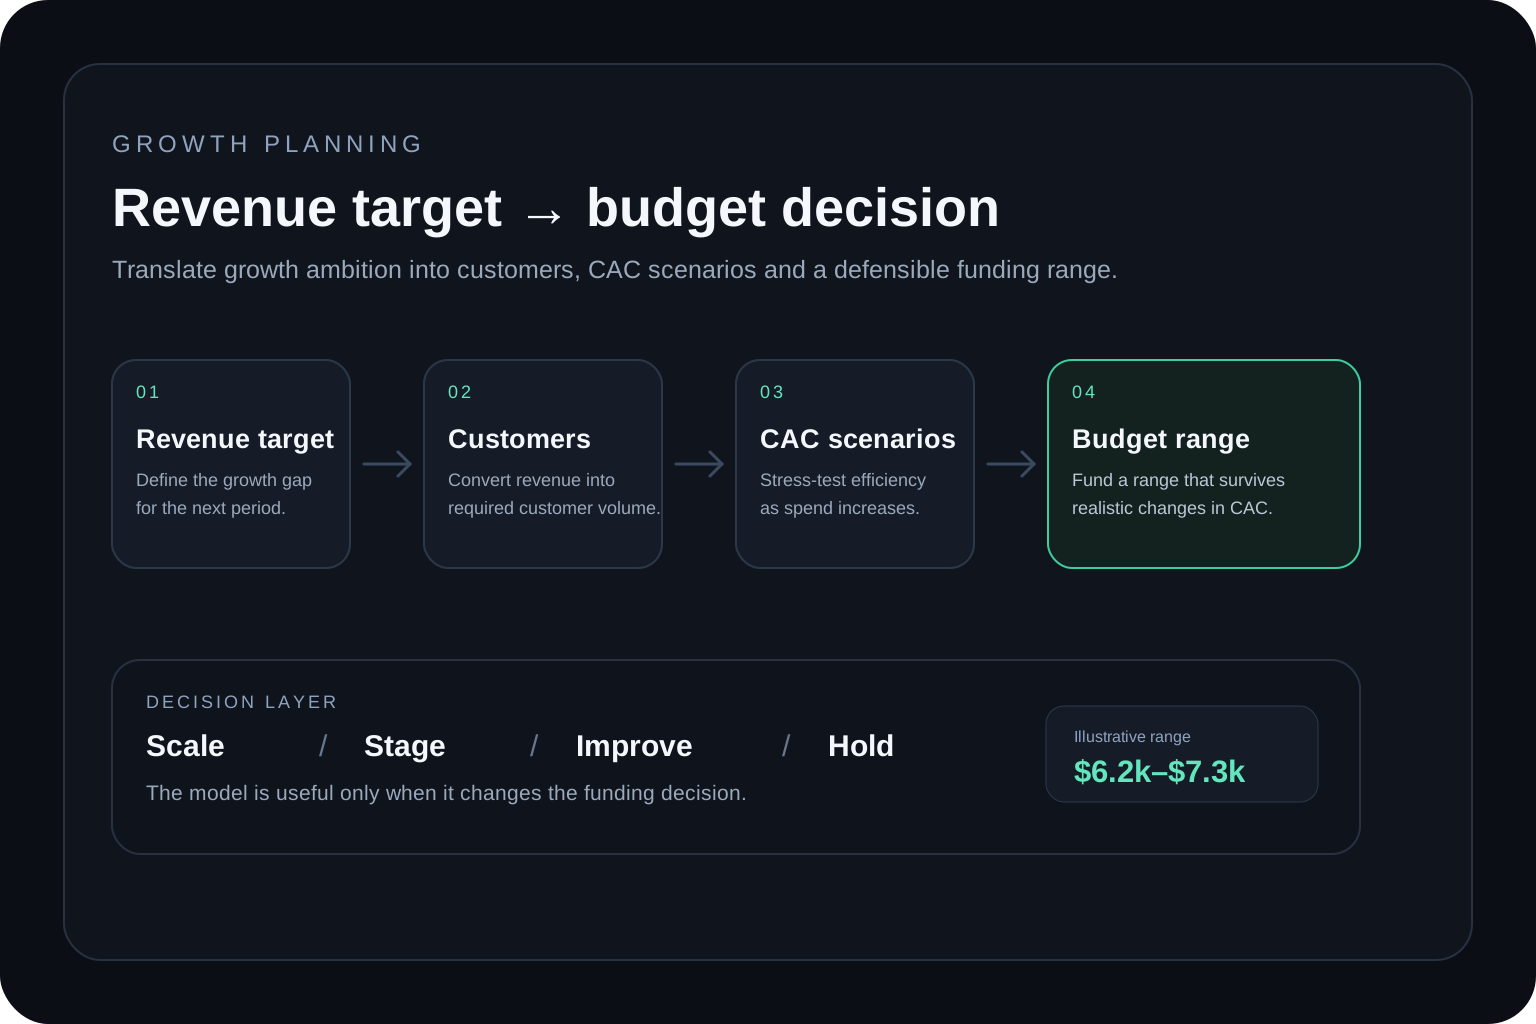
A practical framework for turning a revenue target into a defensible marketing budget using customer volume, CAC scenarios, unit economics and decision-ready data.
Read article
A commercial framework for calculating maximum profitable CAC, protecting payback and deciding whether acquisition spend is ready to scale.
Read article