Unit Economics
Blended CAC vs Paid CAC vs Marginal CAC: Which One Should You Use?
A practical guide to choosing the right CAC metric for paid-channel optimisation, company-level unit economics and marketing scaling decisions.
Read articleShare
A commercial framework for calculating how much the business can afford to pay for the next customer — without confusing revenue LTV, historical CAC or a generic ratio with a safe scaling limit.
A low customer acquisition cost is not automatically good. A high CAC is not automatically bad. The commercial question is whether the value, margin and cash generated by the customer justify what the business must spend to acquire the next one.
That is why founders, CEOs, CMOs and Heads of Growth eventually move beyond asking, “How do we reduce CAC?” and ask a more useful question:
What is the maximum customer acquisition cost we can afford while preserving the profit and payback required by the business?
The answer is not simply LTV, and it is not a universal benchmark. A decision-grade maximum CAC must account for gross margin, variable delivery costs, the profit you intend to retain, the time required to recover cash, and the difference between historical blended CAC and the cost of acquiring additional customers at higher spend.
This guide provides a practical model for calculating a profitable CAC ceiling and turning it into a marketing investment decision.
Start by estimating the contribution value one customer creates over a realistic lifetime. Then calculate two operating constraints:
The lower number becomes the operating maximum CAC:
Operating maximum CAC = minimum of target CAC and cash-safe CAC
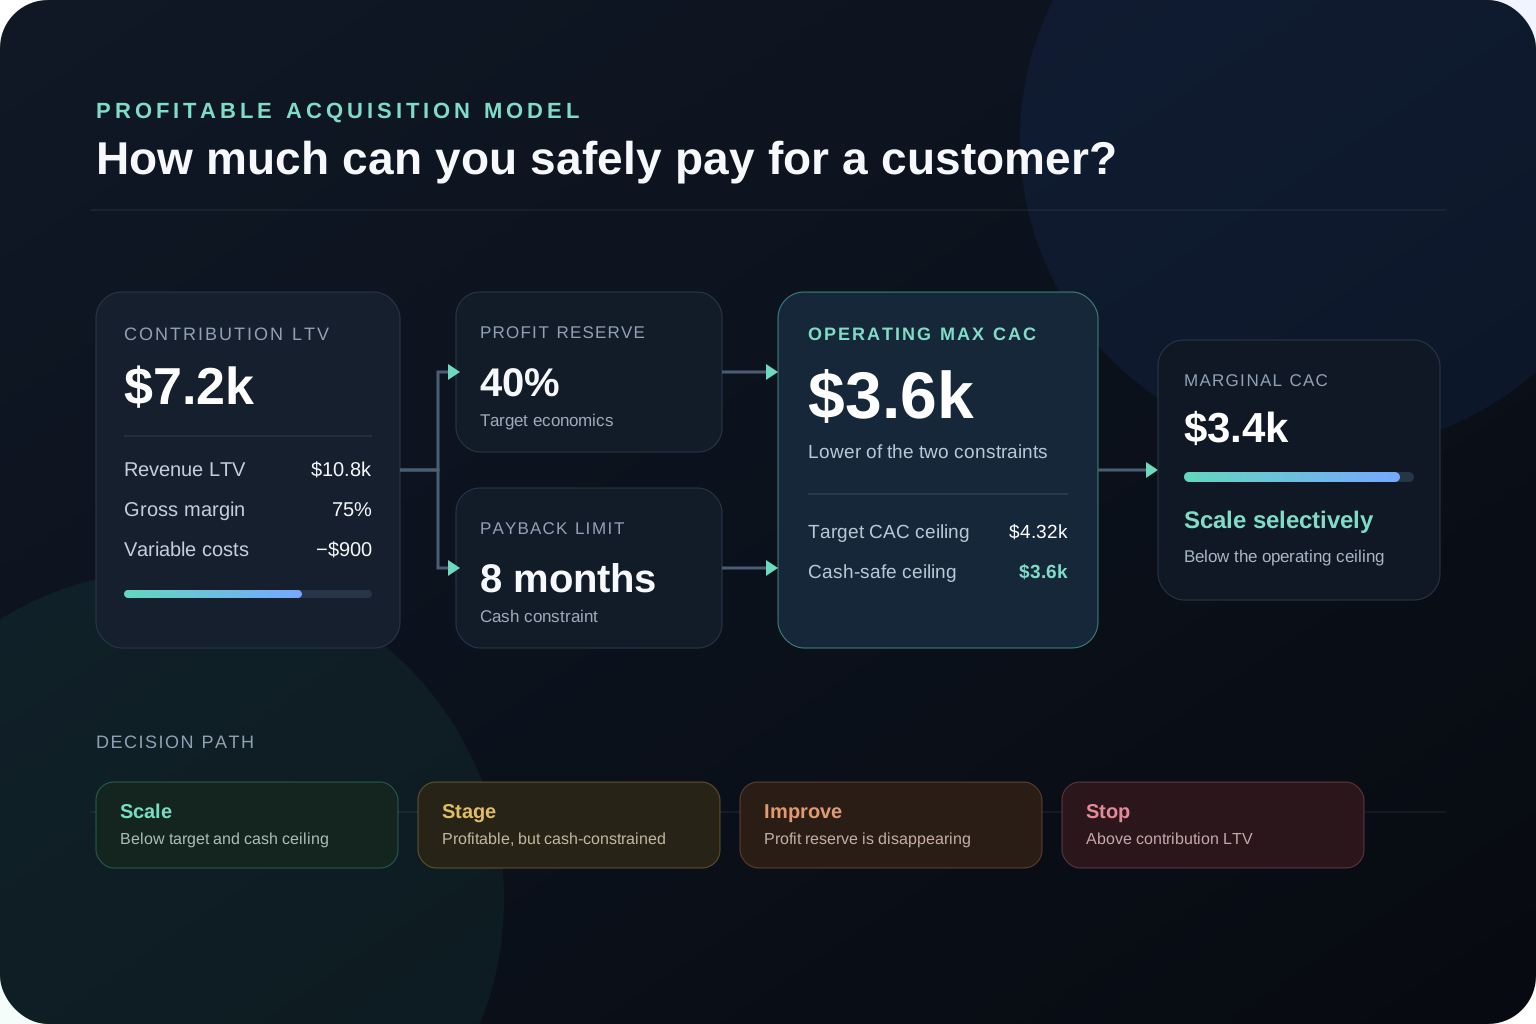
If the target CAC is $4,320 but the current cash plan can support only an eight-month payback equal to $3,600, then $3,600 is the practical ceiling. The larger number may describe lifetime profitability, but it does not fund the next growth cycle safely.
Maximum CAC is a decision boundary, not a target to spend up to under every condition. It answers how much acquisition cost a customer can absorb before one of the business constraints is breached.
There are three useful boundaries:
These numbers answer different questions. Break-even CAC tells you where acquisition becomes value-destructive. Target CAC tells you whether the customer supports the economics you actually want. Cash-safe CAC tells you whether the growth plan can be financed at the required speed.
This distinction is particularly important when recurring revenue looks attractive but retention is uncertain, contracts pay slowly, onboarding is expensive or the business is funding growth from operating cash.
Revenue LTV overstates what is available for customer acquisition because most of that revenue is not free cash. Products must be delivered, payment fees are charged, customers need support, discounts reduce realised value, and some customers churn before the average lifetime is reached.
A useful sequence is:
Contribution LTV = lifetime revenue × gross margin − additional lifetime variable costs
For subscription or repeat-purchase businesses, use cohort retention or a conservative customer lifetime instead of assuming that current monthly revenue continues indefinitely. For project businesses, use expected gross profit from the initial engagement plus only the repeat value supported by actual historical evidence.
| Input | What it should represent | Preferred source | Common error |
|---|---|---|---|
| Lifetime revenue | Revenue from a comparable customer cohort over a defensible lifetime | Billing, CRM or cohort revenue data | Using an indefinite lifetime |
| Gross margin | Margin attributable to the same customer, product and period | Finance or management accounts | Using revenue as if it were profit |
| Variable customer costs | Onboarding, service, fulfilment, payment and incentive costs not already included | Operations and finance | Double-counting costs already in gross margin |
| Profit reserve | Contribution retained after acquisition for overhead, risk and profit | Operating plan | Letting acquisition consume all customer value |
| Payback limit | Maximum time the business can wait to recover acquisition cash | Cash-flow plan and growth capacity | Choosing a benchmark without considering runway |
| Marginal CAC | Expected CAC for the next spend level, channel or audience | Channel cohorts and spend-response analysis | Using blended CAC from cheaper historical volume |
At a simplified customer-contribution level, break-even CAC equals contribution LTV:
Break-even CAC = contribution LTV
This is an economic red line, not a recommended acquisition target. Spending at break-even leaves nothing from the customer to cover fixed overhead, financing, product development or profit. It also assumes the LTV estimate will be realised exactly, which is rarely a safe planning assumption.
Choose the contribution-profit reserve the business intends to keep after acquisition:
Target CAC = contribution LTV × (1 − required contribution-profit reserve)
If contribution LTV is $7,200 and the business wants to retain 40%, the target CAC ceiling is $4,320. The reserve is not a universal benchmark. It should reflect fixed costs, strategic reinvestment, forecast risk and the return the business expects from growth.
Estimate the recurring or periodic contribution generated before acquisition cost, then multiply it by the maximum acceptable payback period:
Cash-safe CAC = contribution per period × maximum acceptable payback periods
A customer may be profitable over eighteen months and still create an uncomfortable cash burden if the business needs acquisition capital back in eight. Payment timing, annual prepayment, churn concentration and working capital can all change this ceiling.
Consider a recurring-revenue business with the following planning inputs:
The calculation becomes:
The operating maximum CAC is therefore $3,600, because the cash-safe ceiling is lower than the $4,320 target ceiling.
Margin, variable delivery costs, the required profit reserve and cash recovery progressively reduce the amount the business can safely pay for a customer.
Revenue LTV
$10.8k
$600 monthly revenue × 18 months
Gross-profit LTV
$8.1k
After 75% gross margin
Contribution LTV
$7.2k
After $900 variable onboarding and success costs
Target CAC ceiling
$4.32k
After preserving a 40% contribution-profit reserve
Cash-safe CAC
$3.6k
Capped by an eight-month payback limit
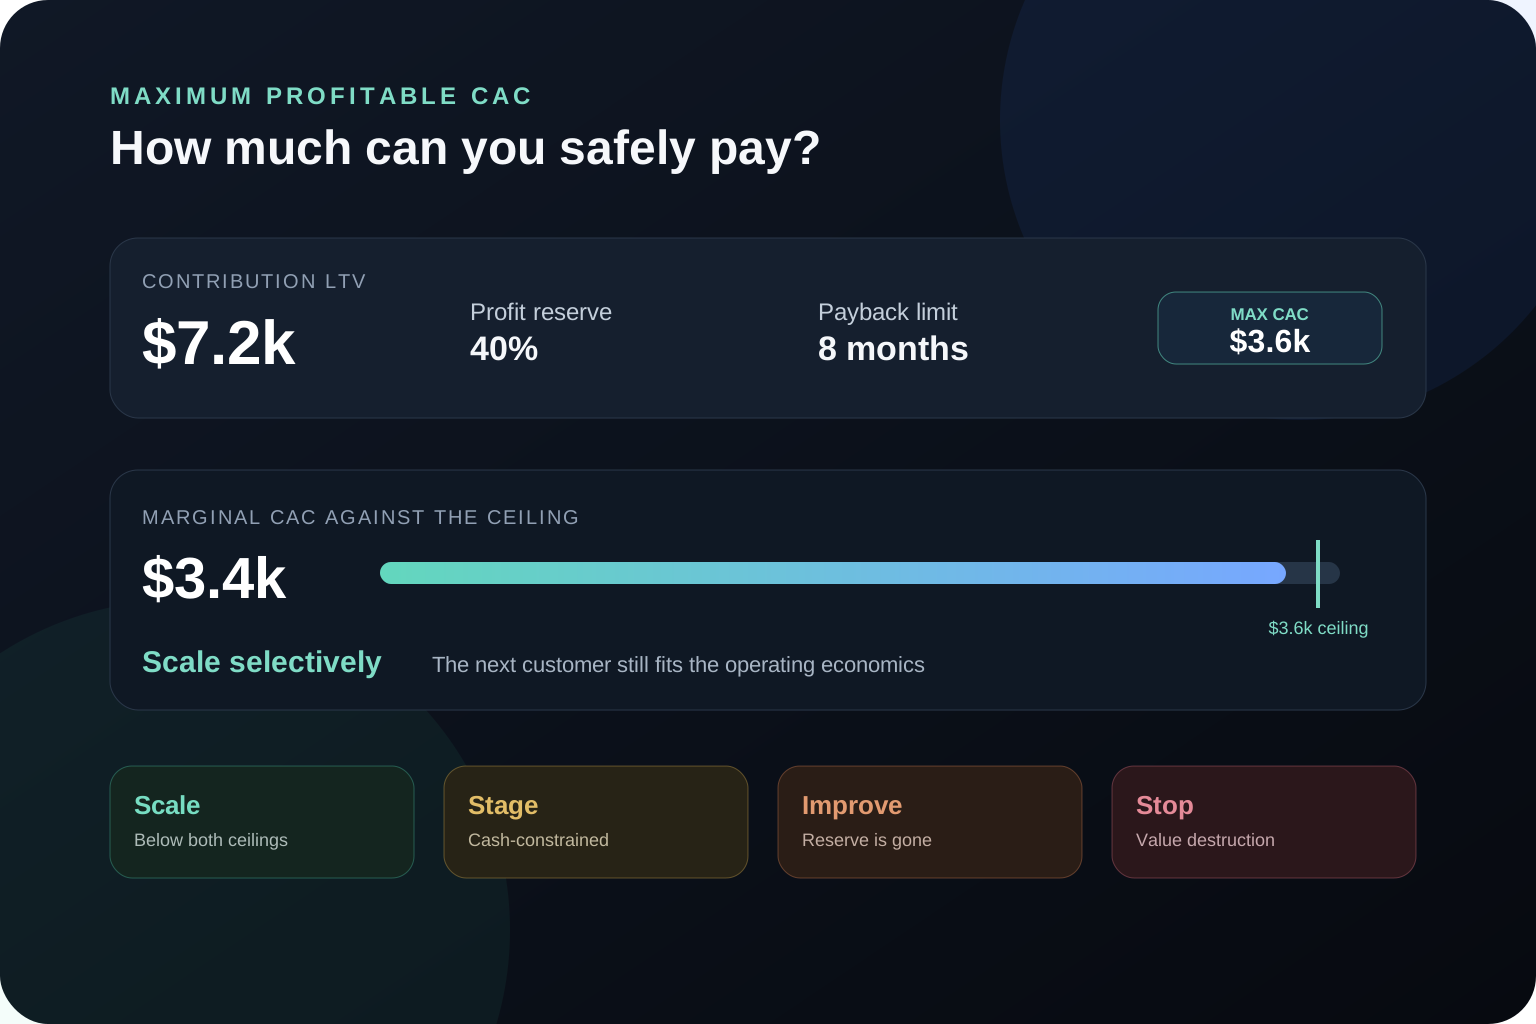
If current blended CAC is $2,800, the acquisition program appears comfortably profitable. But if increasing monthly spend is expected to move marginal CAC to $3,400, the remaining headroom is only $200 — not the $800 implied by the historical average.
That difference changes the management decision from “increase budget broadly” to “scale selectively, monitor the next cohort and define a stop-loss before committing the full budget.”
You can model the interaction between retention, margin, CAC and cash recovery in the Predictive LTV & Payback tool before using one ceiling as a budget rule.
A target LTV:CAC ratio can be useful as a shorthand. For example, a 3:1 ratio implies that CAC should not exceed one third of the LTV definition used in the model. But the ratio is not enough to establish whether acquisition is ready to scale.
Two businesses can show the same ratio and face completely different decisions:
A high ratio can even indicate underinvestment if profitable demand is being left uncaptured. A lower ratio can be acceptable when cash arrives quickly, retention is proven and incremental customers still create the required contribution. The ratio should prompt questions, not replace the model.
The broader CAC, LTV and payback period guide explains how those three metrics work together. This article uses them for the narrower commercial decision: setting the maximum CAC for the next acquisition investment.
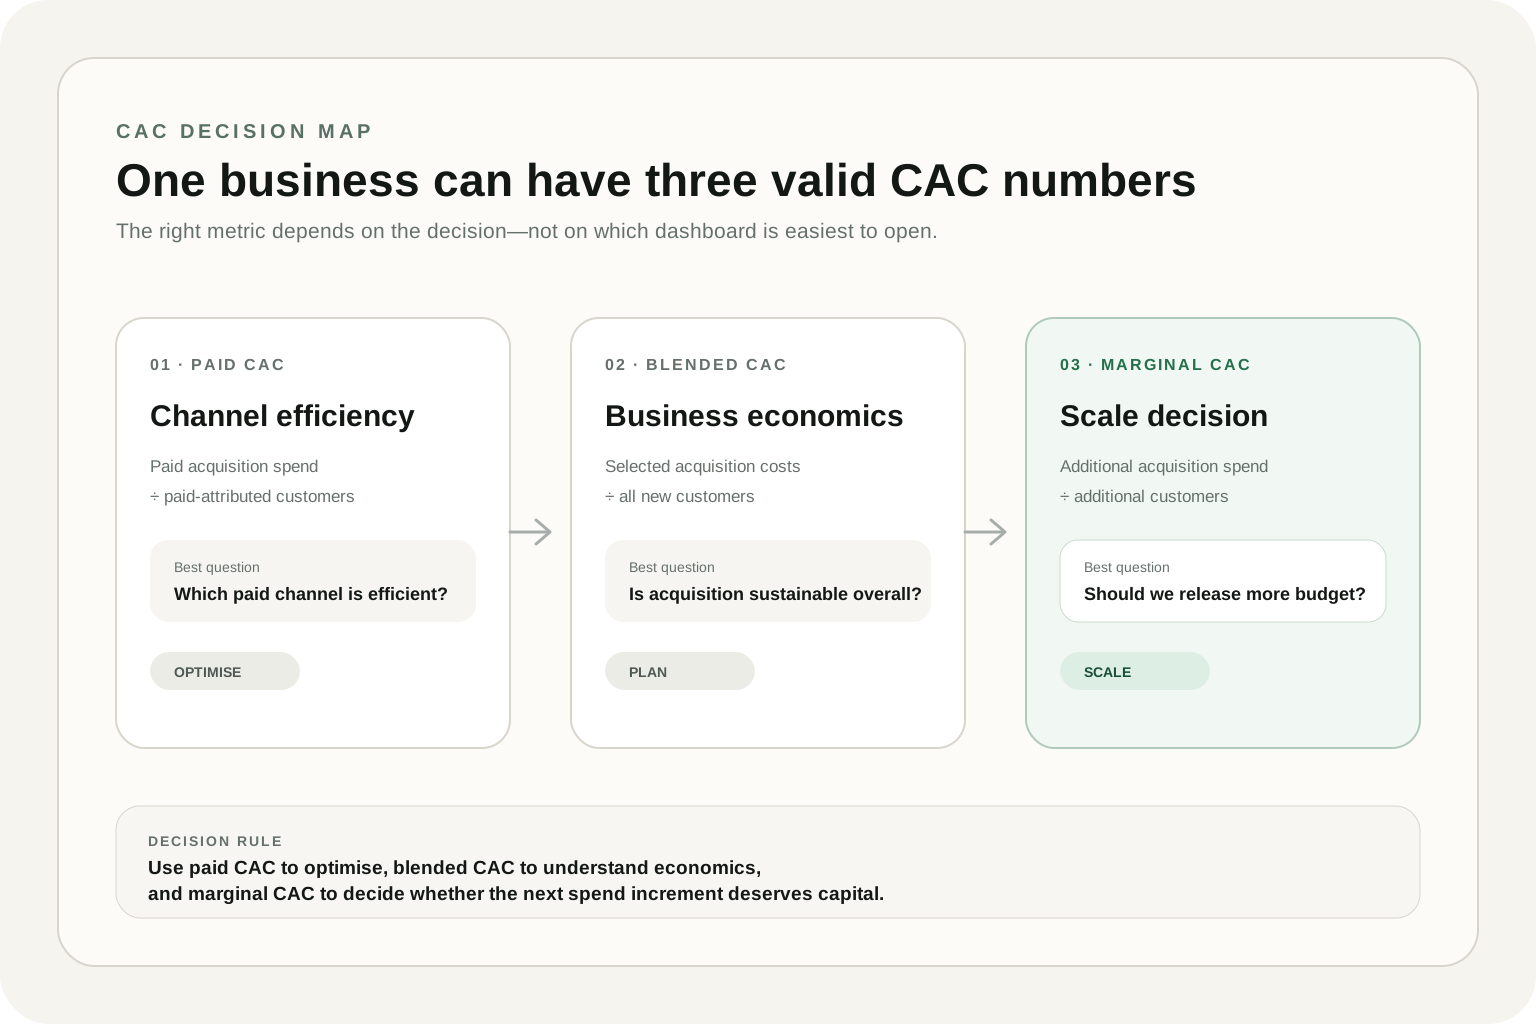
Blended CAC answers what the existing customer base cost on average. Marginal CAC estimates what the next customers will cost at the next level of spend. Budget decisions should use both, but the marginal number is the more relevant comparison with maximum CAC.
Marginal CAC can rise because:
Model a Conservative, Base and Upside marginal CAC before allocating the next budget. Then decide how much spend can be released initially and what evidence is required before the next stage.
When the growth target must also be translated into customer volume and a funding range, use the marketing budget for a revenue target framework. Maximum CAC becomes one of its key economic constraints.
A CAC ceiling is valuable only when it changes how budget is approved, monitored and stopped. Use the first breached constraint to determine the next action.
One profitable historical average does not authorize unlimited scale. The next customers should be evaluated against the next-dollar CAC and the first ceiling they breach.
Below $3.6k
Scale selectively
Marginal CAC remains below the target and cash-safe ceilings.
$3.6k–$4.32k
Stage and validate
Lifetime economics may work, but payback exceeds the current cash constraint.
$4.32k–$7.2k
Improve before scaling
Customers may still repay CAC eventually, but the required profit reserve is gone.
Above $7.2k
Stop or redesign
Acquisition destroys contribution value before fixed overhead and financing costs.
| Position | Economic meaning | Recommended action | Evidence required next |
|---|---|---|---|
| Marginal CAC below target and cash-safe ceilings | The next customers preserve target profit and acceptable payback | Scale selectively | Incremental cohort quality and marginal CAC stability |
| Above cash-safe CAC but below target CAC | Lifetime economics may work, but cash recovery is too slow | Stage | Payment timing, runway and a smaller controlled budget release |
| Above target CAC but below break-even CAC | The customer may repay acquisition but misses the required return | Improve | Conversion, channel mix, pricing, margin, activation or retention plan |
| Above contribution LTV | Acquisition destroys customer contribution value | Stop or redesign | Corrected measurement and a materially different economic model |
A precise maximum CAC calculated from weak inputs creates false confidence. Before using the number to scale advertising, check whether the underlying data describes the same customers, period and cost definition.
At minimum, verify:
If Google Ads, GA4 and the CRM disagree on which conversions became customers, resolve the material definitions before increasing the budget. The GA4 versus Google Ads conversion discrepancy framework helps determine whether the gap is expected, fixable or dangerous for budget allocation.
A self-service maximum CAC calculation is useful when the definitions are consistent and the decision affects one relatively stable business model. A deeper unit economics review is more appropriate when:
Unit Economics & Growth Strategy connects CAC, contribution LTV, payback and budget scenarios to an actionable growth plan. The Mental Health Marketing Analytics case study shows why acquisition decisions become more reliable when measurement, activation, retention and cash recovery are evaluated together.
If the uncertainty extends across funnel performance, measurement quality and channel priorities, a Growth Audit can identify whether the constraint is acquisition cost, customer value, conversion quality or the system used to measure them.
A good CAC is one that preserves the business’s required contribution profit, can be recovered within an acceptable payback window and remains sustainable as spend increases. There is no universal good CAC in dollars or as a single ratio.
Calculate contribution LTV, subtract the contribution-profit reserve through a target-CAC formula, calculate the CAC supported by the acceptable payback period, and use the lower of the target and cash-safe ceilings.
Only as a simplified break-even boundary when LTV already means contribution value after all relevant variable costs. Using that amount as a target would leave no customer contribution for fixed costs, profit or forecast error.
Not necessarily. The result depends on how LTV and CAC are defined, when cash is collected, how certain retention is and whether important sales, service or delivery costs are excluded.
Use the definition that matches the decision. Media CAC helps manage channel execution. Fully loaded CAC is better for judging whether the overall acquisition system — including people, tools, creative and sales costs — is economically sustainable. Keep both definitions visible and do not compare one with a ceiling calculated for the other.
Yes. A customer segment with better retention, higher margin, larger expansion revenue or faster cash collection may support a higher CAC than a cheaper but lower-quality segment. Profitability depends on customer economics, not on CAC in isolation.
Review it whenever pricing, margin, retention, channel mix or payment timing changes materially. For an active acquisition program, a monthly operating review with cohort-level validation is a practical starting cadence.
Maximum CAC should connect finance, marketing, sales and retention around one explicit acquisition boundary. It should show how much value a comparable customer contributes, how much profit must remain, how quickly cash must return and what the next customer is expected to cost.
The practical sequence is:
Ready to pressure-test the economics? Model LTV, CAC and payback using your assumptions.
Need a decision model across cohorts, channels or markets? Review Unit Economics & Growth Strategy or discuss your acquisition economics.
Share this article
Next step
Model customer value, margin, retention and payback together, then compare the result with the acquisition cost of the next customers you plan to buy.
Related
A practical guide to choosing the right CAC metric for paid-channel optimisation, company-level unit economics and marketing scaling decisions.
Read article
A practical guide to CAC, LTV and payback that separates decision-grade unit economics from misleading averages—so growth leaders know when to scale, investigate or stop spend.
Read article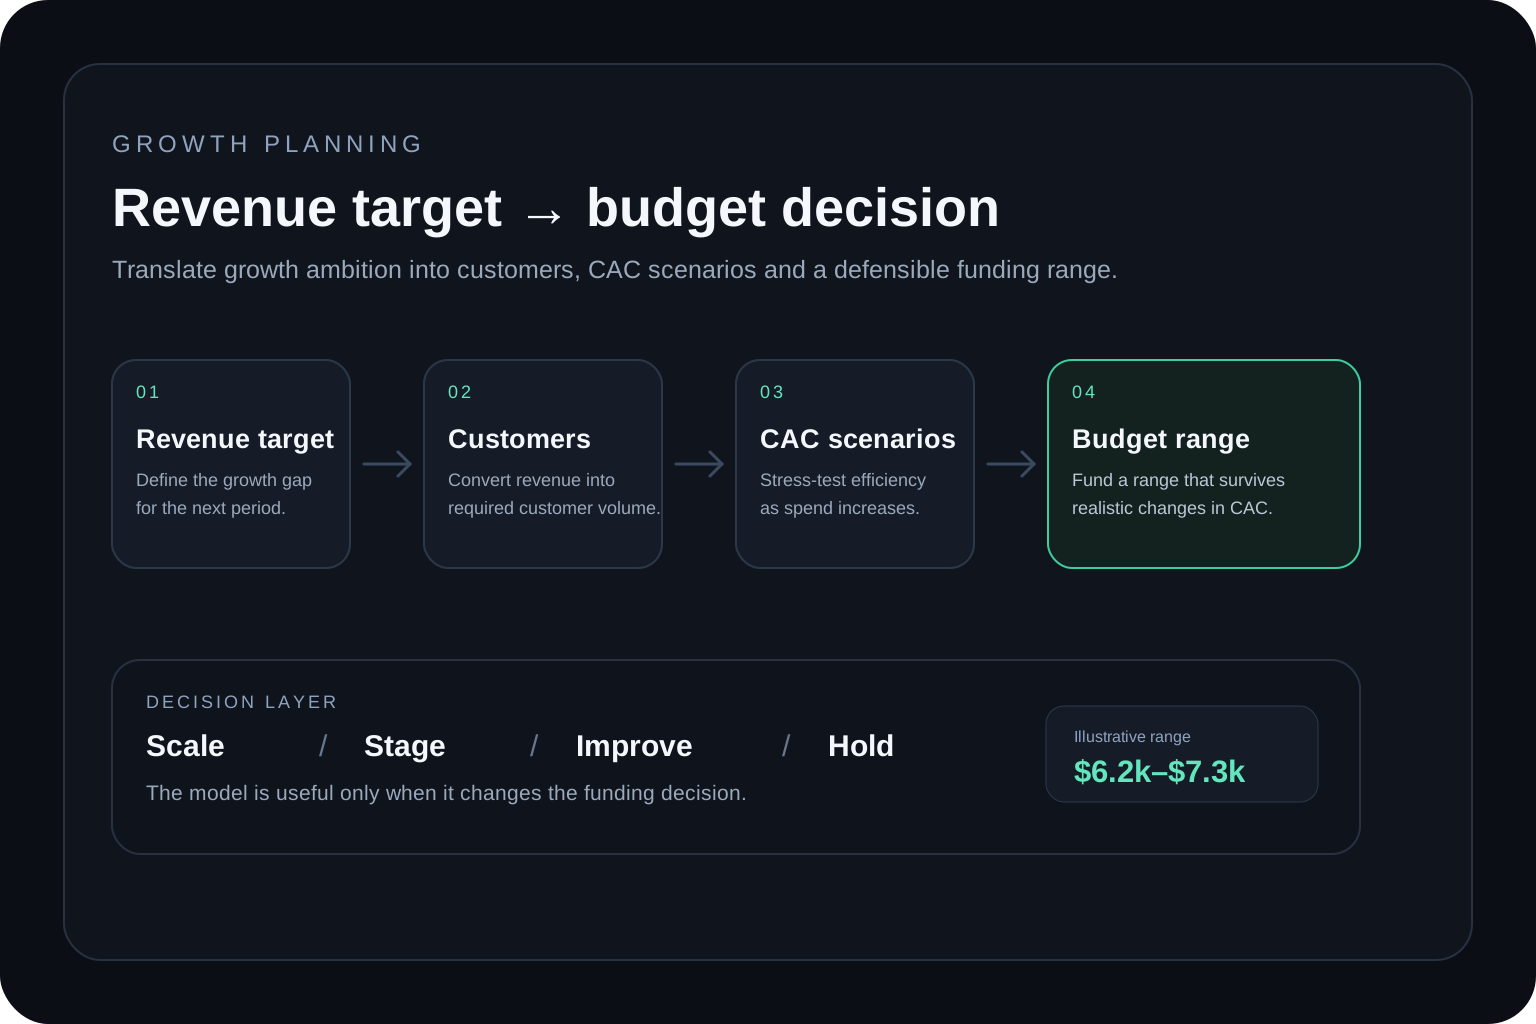
A practical framework for turning a revenue target into a defensible marketing budget using customer volume, CAC scenarios, unit economics and decision-ready data.
Read article