How Much Should You Spend on Marketing to Hit a Revenue Target?
A practical framework for working backward from a revenue target to the customers, CAC assumptions and budget range the business can actually defend.
A revenue target is not a marketing budget. It becomes one only after you translate the target into the number of customers you need, the acquisition cost you can support, and a realistic range of outcomes if efficiency changes as spend increases.
For business owners, CEOs, CMOs and growth leaders, the useful question is not simply, “What percentage of revenue should go to marketing?” It is:
What level of marketing investment gives us a defensible path to the revenue target — without assuming that customer acquisition cost will remain unchanged as we scale?
The answer should rarely be one exact number. A better plan starts with the latest completed month, works backward from the revenue target, compares several acquisition scenarios, and checks whether unit economics, cash recovery and measurement quality support the decision.
This guide shows how to do that without turning marketing budgeting into a finance textbook or an overly technical forecasting exercise.
The short answer: work backward from the revenue goal
To estimate the acquisition budget required for a revenue target, you need four consistent inputs from the latest completed month:
acquisition-focused marketing spend;
customer acquisition cost, or CAC;
revenue per newly acquired customer for the same measurement window;
the target revenue growth rate for the next planning period.
From there, calculate the current number of acquired customers, the revenue generated by those customers, the target revenue, and the number of customers required to reach it.
A simple flat-CAC calculation can give you a useful starting point:
Required customers × current CAC = starting budget estimate
But it is only a starting point. If the next budget increase reaches more expensive audiences, placements or channels, the actual CAC may be higher. If creative, conversion rate or channel mix improves, CAC may be lower. This is why a decision-grade marketing budget should be expressed as a planning range with Conservative, Base and Upside scenarios, not as a guaranteed answer.
First define which “marketing budget” you are calculating
Before using any formula, define the scope of the budget.
A total marketing operating budget may include:
acquisition media;
brand investment;
content and SEO;
retention and lifecycle programs;
salaries, agencies and contractors;
analytics, creative and software;
research, events and partnerships.
The framework in this article is narrower. It estimates the acquisition-focused marketing spend tied to a measurable revenue target and newly acquired customers.
That distinction matters. If you combine paid acquisition, an internal marketing team, brand production and retention programs into one number, then divide it by new customers, your CAC may no longer represent the decision you are trying to make. Equally, if “revenue per customer” includes renewals from the existing customer base while CAC covers only new acquisition, the model will overstate the revenue that new spend can reasonably support.
Use one customer definition, one attribution window and one revenue window across every input. For a business with large organic, recurring or partner-driven revenue, isolate the acquisition-driven portion rather than treating the entire company revenue target as if paid marketing must produce it alone.
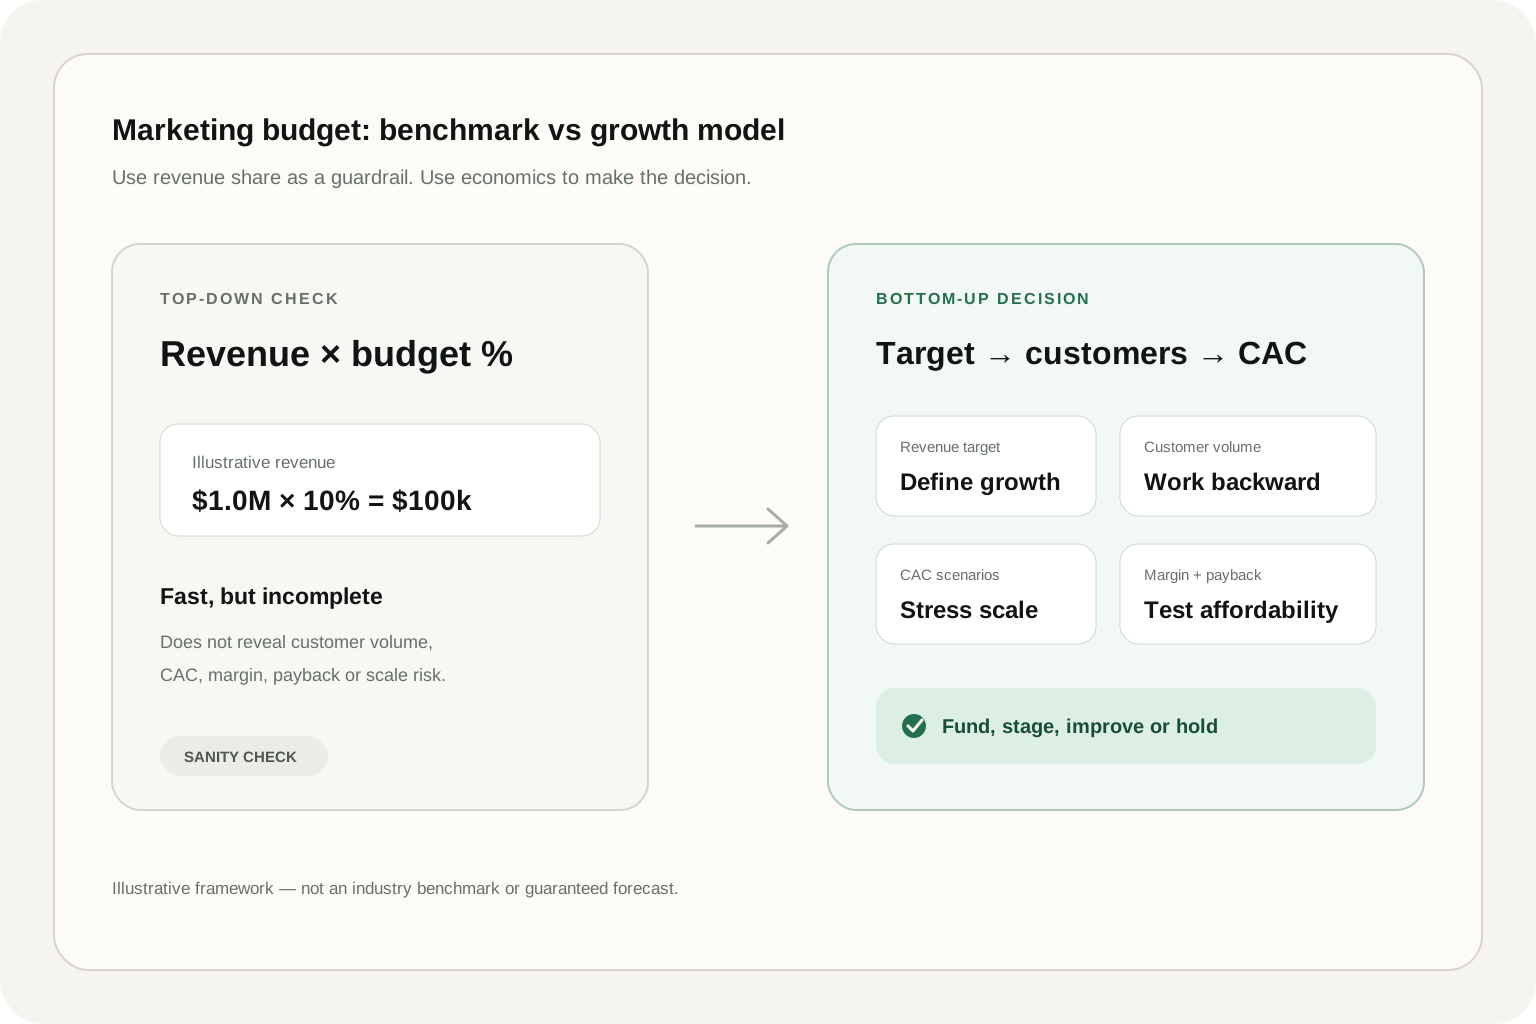
Why percentage-of-revenue benchmarks are only a guardrail
Percentage rules are popular because they are fast. They can help a leadership team ask whether marketing investment looks unusually low or high compared with a broad market reference.
But they do not calculate the budget required for your growth target.
Two current surveys illustrate the limitation. Gartner reported that marketing budgets averaged 7.8% of company revenue in 2026, while The CMO Survey’s 2026 topline report reported a mean of about 9.0%, with a median of 5% and a very wide spread across respondents. Gartner’s finding is available in its 2026 CMO Spend Survey announcement.
The difference does not mean one survey is wrong. It shows that benchmarks depend on the sample, business model, growth stage, accounting definition and market conditions.
A percentage of revenue cannot tell you:
how many customers the business must acquire;
whether CAC is $80 or $800;
how much revenue each new customer produces;
whether margins can support the acquisition cost;
whether the next budget increment will be less efficient than the last;
whether the data is reliable enough to make the decision.
Use a benchmark as a sanity check after building a bottom-up model. Do not use it as the model itself.
Start with the latest completed month
The latest completed month gives you a factual baseline. It is recent enough to reflect the current offer, pricing, channel mix and market conditions, while avoiding the distortion of a partial month.
Table 1. The four inputs behind a revenue-based marketing budget
Swipe horizontally to view all columns →
Table 1. The four inputs behind a revenue-based marketing budget
Input
What it means
Why it matters
Common mistake
Monthly marketing spend
Acquisition-focused spend in the latest completed month
Defines the current investment level
Mixing media spend with salaries, brand work or unrelated operating costs
Customer acquisition cost
Spend divided by newly acquired customers
Connects investment to customer volume
Using leads in one report and customers in another
Revenue per acquired customer
Revenue attributed to one newly acquired customer for the same window
Connects customer volume to the revenue target
Including mature-customer or renewal revenue that the current acquisition cohort has not produced
Target revenue growth
Desired increase versus the latest completed month
Defines the next planning objective
Using a target that applies to total company revenue when the model covers only acquisition-driven revenue
The baseline should answer three simple questions:
How many customers did the latest spend acquire?
How much comparable revenue did those customers produce?
What has to change to reach the next revenue target?
If the team cannot answer those questions with consistent definitions, the first priority is not increasing the budget. It is fixing the measurement foundation.
Calculate the budget from the revenue target
The calculation can be explained in five steps.
Step 1: Estimate acquired customers in the baseline month
Current acquired customers = monthly marketing spend ÷ CAC
If the business spent $5,000 and CAC was $100, the baseline represents 50 acquired customers.
At $500 per customer, the business needs 60 acquired customers to reach $30,000.
Step 5: Translate the customer target into spend
A flat-CAC starting point would be:
60 customers × $100 CAC = $6,000
That number is easy to understand, but it contains a strong assumption: the next 10 customers can be acquired at the same average cost as the previous 50.
That assumption may be reasonable for a small increase inside a stable channel. It becomes less defensible as the budget moves into new audiences, new geographies, more expensive auctions or lower-intent inventory.
Decision model
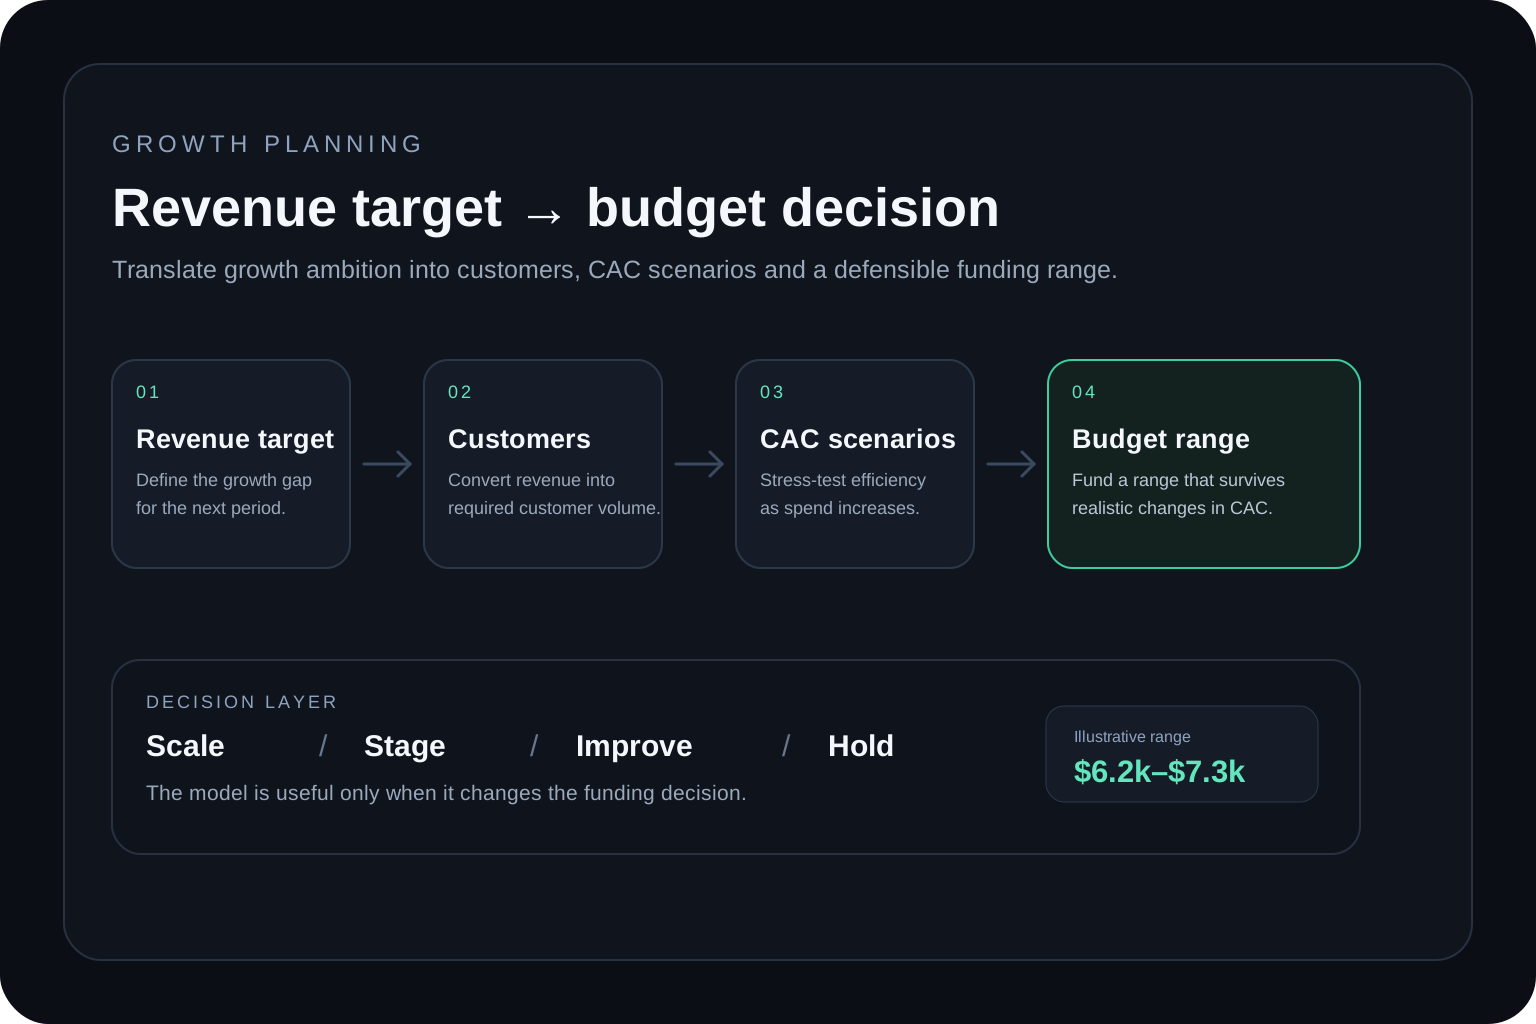
From a revenue target to a budget decision
Keep the logic visible. More sophisticated inputs should improve the assumptions, not hide the decision path.
01
Revenue target
Define the measurable growth gap for the next planning period.
02
Customers required
Translate the revenue gap into customer volume using comparable revenue per customer.
03
CAC scenarios
Stress-test what happens if acquisition efficiency improves, holds or deteriorates.
04
Budget range
Fund a defensible range instead of relying on one falsely precise number.
05
Growth decision
Scale, stage, improve or hold based on economics and evidence quality.
A planning model should connect the target, customer requirement, acquisition assumptions and management action in one traceable chain.
Example: growing acquired-customer revenue from $25,000 to $30,000
Consider a hypothetical business with the following latest completed month:
marketing spend: $5,000;
CAC: $100;
revenue per acquired customer: $500;
target growth: 20%.
The flat-CAC estimate is $6,000. A scenario-based model gives a more useful view because it allows acquisition efficiency to change as spend increases.
At a common Base planning budget of approximately $6,196, the scenarios produce different outcomes:
Table 2. Illustrative scenario outcomes at one planning budget
Swipe horizontally to view all columns →
Table 2. Illustrative scenario outcomes at one planning budget
Scenario
Forecast CAC
Expected customers
Expected revenue
Interpretation
Conservative
$116.06
53.39
$26,693.97
The target is missed if acquisition efficiency deteriorates materially
Base
$103.27
60.00
$30,000.00
The target is reached under central planning assumptions
Upside
$96.02
64.53
$32,263.62
Better efficiency creates additional headroom, but it is not guaranteed
The corresponding risk-adjusted budget range is approximately $6.2k to $7.3k, rather than one falsely precise $6,000 recommendation.
The purpose of this range is not to predict the future with certainty. It is to show how sensitive the decision is to CAC and to define a more realistic boundary for planning.
Illustrative scenario model
Marketing spend versus expected acquired-customer revenue
The same budget can support materially different outcomes when CAC changes. The purpose is sensitivity analysis, not a guaranteed forecast.
Planning budget≈ $6.2k
Conservative$26.7k
Stress weaker acquisition efficiency
Base$30.0k
Central operating assumption
Upside$32.3k
Show headroom if execution improves
Revenue target: $30k. Recommended planning range in this illustrative case: $6.2k–$7.3k.
ConservativeBaseUpside$30k target
Conservative
Stress weaker acquisition efficiency
Base
Central operating assumption
Upside
Show headroom if execution improves
Illustrative example only. Scenario curves are not industry benchmarks, confidence intervals or guaranteed outcomes.
Why the required budget is usually a range
Marketing performance does not change for one reason alone.
CAC may rise as spend increases because the business reaches beyond its strongest audiences, competes in more expensive auctions, expands into lower-intent inventory or adds channels with different economics. Conversion rate may also weaken if sales capacity, onboarding, inventory or landing-page performance cannot absorb the additional demand.
But deterioration is not universal. CAC may improve when the business strengthens the offer, creative, targeting, conversion journey, pricing, sales follow-up or measurement feedback loop.
This is why the model should not claim that more spend causes worse CAC in every business. It should test what happens if efficiency is better, similar or worse than the recent baseline.
A practical scenario range answers three different management questions:
Conservative: can the plan survive under weaker efficiency?
This scenario tests whether the target remains fundable if CAC rises more than expected or revenue per acquired customer comes under pressure.
It is especially useful when the budget increase is large, the channel is already saturated, the historical evidence is weak or the next period includes a new market, offer or audience.
Base: what is the central planning case?
The Base scenario is the operating plan. It should use the most defensible current assumptions and make the revenue target explicit.
The Base case is not “what will happen.” It is the reference against which the team decides how much to fund, what to monitor and when to revise the plan.
Upside: what headroom exists if execution improves?
The Upside scenario shows the value of stronger acquisition efficiency or customer revenue. It helps leadership understand potential leverage, but it should never be used as the only budget justification.
None of these scenarios is a probability of success. They are transparent stress cases for decision-making.
Check whether the target is economically fundable
A revenue target can be mathematically reachable and still be a poor business decision.
Before approving the budget, connect the acquisition plan to:
contribution margin;
customer lifetime value;
CAC payback;
refunds, cancellations or failed payments;
cash available to fund the payback period;
operational capacity to serve the added customers.
For example, a business may be able to acquire 60 customers at the required budget, but the plan may still destroy value if contribution per customer is too low or cash recovery is too slow.
This is where average revenue per customer is not enough. Revenue explains top-line output. Margin and payback explain whether the business can sustain the investment.
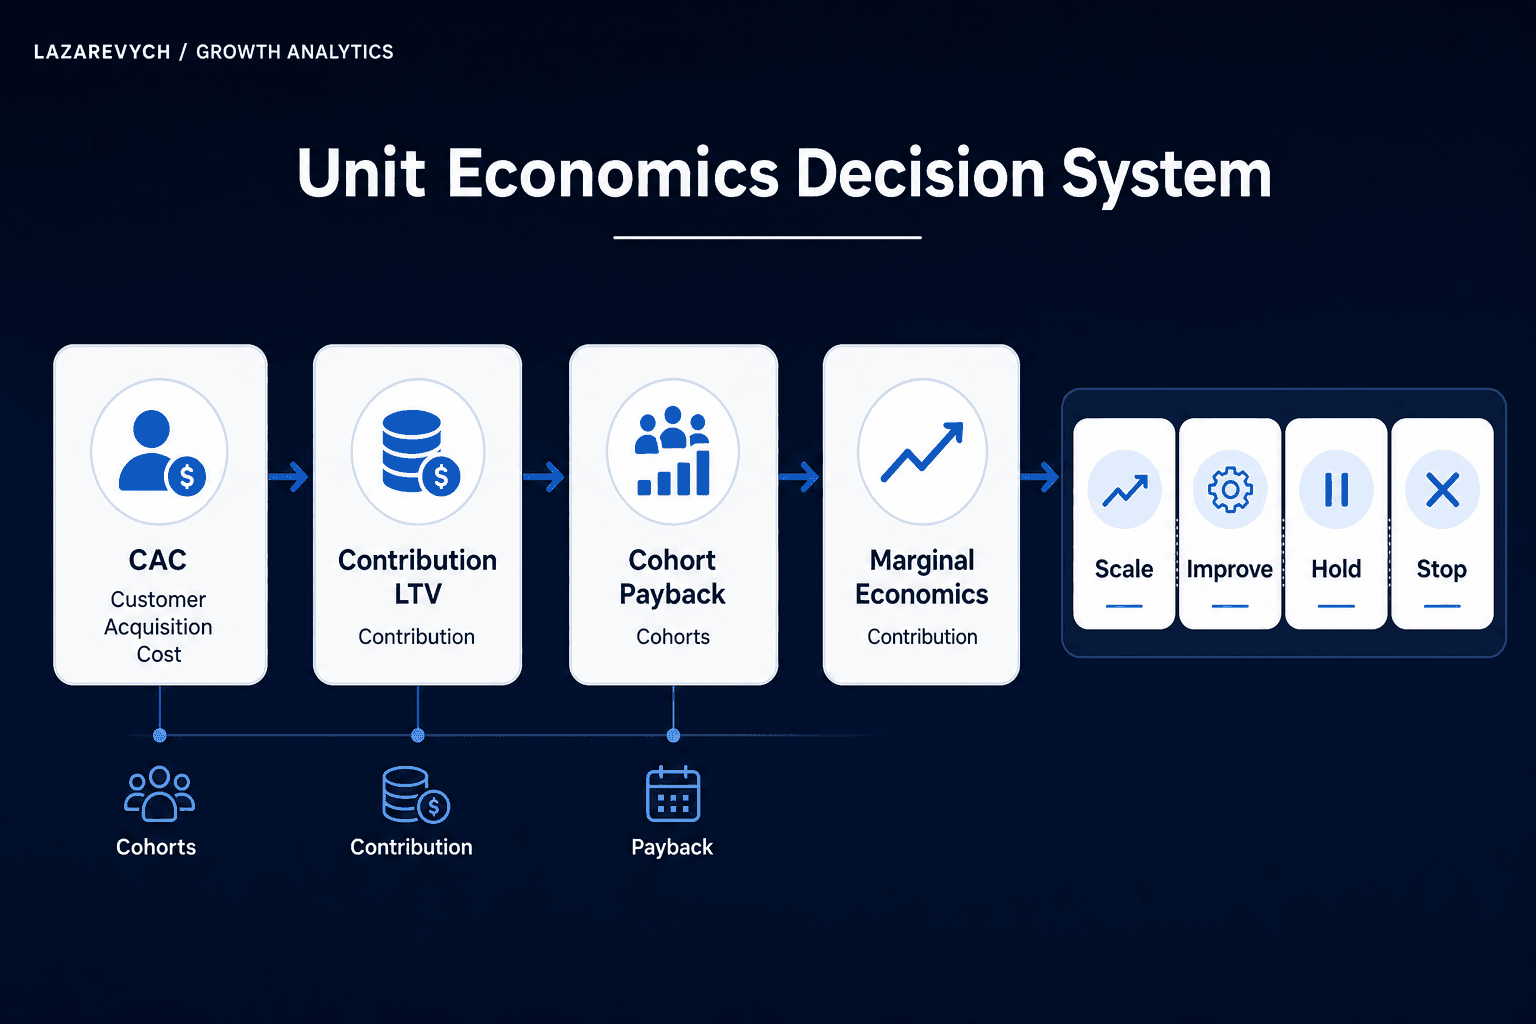
The CAC, LTV and payback guide explains how to move from acquisition volume to decision-grade unit economics. For a self-service scenario, the Predictive LTV & Payback Calculator can test how retention, margin and CAC affect customer value and cash recovery.
When the business must reconcile several products, markets, cohorts or channel economics before funding the plan, Unit Economics & Growth Strategy provides the commercial bridge from a budget model to an implementation and prioritisation system.
The Mental Health Marketing Analytics case study also shows why budget decisions become more reliable when acquisition cost is evaluated beside activation, retention, payback and customer value rather than in isolation.
Check whether the data is decision-ready
A model cannot repair inconsistent inputs.
Before increasing spend, verify that:
marketing spend covers the same channels and period used in CAC;
“customer” means the same thing in advertising, analytics, CRM and finance;
revenue per customer uses the same cohort and measurement window;
duplicate or missing conversions are not distorting CAC;
acquisition source survives the journey into the CRM or billing system;
the latest completed month is representative rather than a one-off promotion, outage or seasonal spike.
The systems do not need to report identical totals. Attribution models, processing time, consent, refunds and time zones can create legitimate differences. The requirement is that the team understands and can explain the differences.
A practical way to test this is to trace one journey:
Ad or source → website conversion → CRM customer → revenue record → budget decision
If the journey breaks between analytics and the CRM, the business may optimize toward leads that never become valuable customers. If revenue cannot be connected back to the acquisition cohort, revenue per customer becomes an assumption rather than evidence.
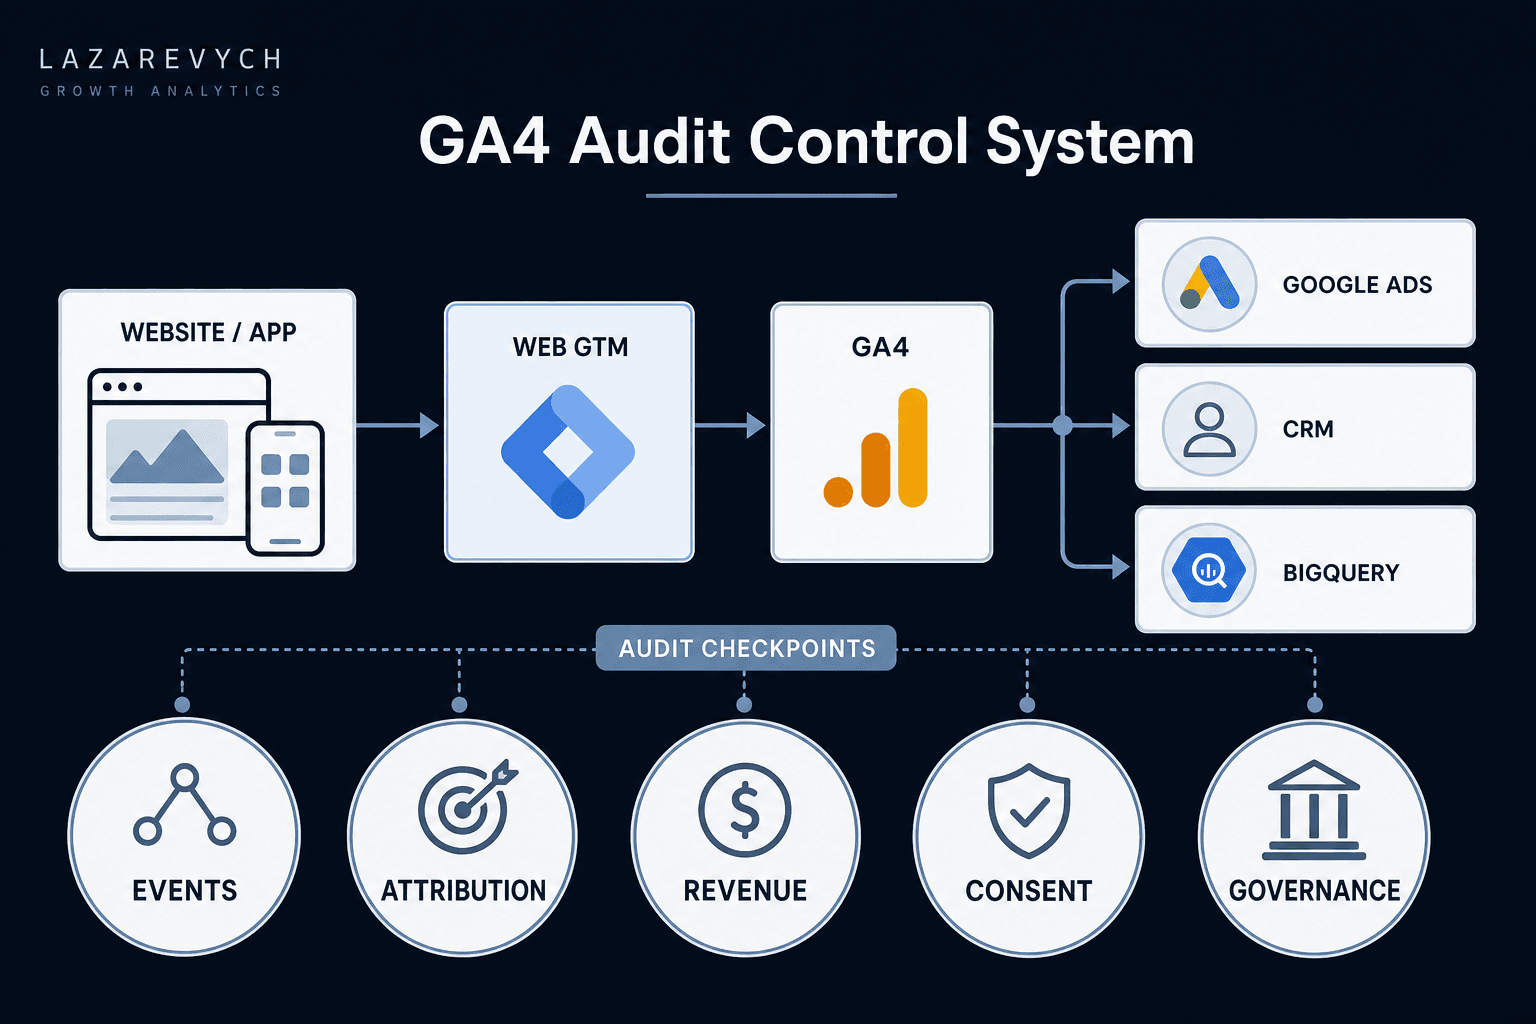
Use the GA4 audit checklist when tracking, attribution or revenue reconciliation is uncertain. If the problem is broader than GA4 — for example, fragmented identity, CRM outcomes, offline conversions or disconnected reporting — review the marketing analytics infrastructure required to connect acquisition to commercial outcomes.
A Growth Audit is more appropriate when the concern is not one implementation defect but the overall quality of the assumptions, funnel economics and decision process behind a high-risk growth plan.
Choose the next action: scale, stage, improve or hold
A useful budget model should end with a decision, not another dashboard.
Scale
Scale when the Base case reaches the target, the Conservative case remains commercially acceptable, unit economics support the investment, and the budget increase stays within a range the business can validate and operate.
Scaling does not mean committing the entire annual increase on day one. It means the evidence supports moving forward with defined monitoring and stop conditions.
Stage
Stage the increase when the target is plausible but the recommended budget materially exceeds recent spend, historical support is limited or the Conservative outcome creates a meaningful shortfall.
Release the budget in increments. Recalculate after enough new evidence exists to update CAC, customer quality and revenue per acquired customer.
Improve
Improve before scaling when the constraint is fixable: weak conversion rate, poor sales follow-up, low-quality acquisition, pricing friction, unreliable tracking, slow onboarding or inconsistent definitions.
A better funnel can increase the amount of revenue the same budget can support. It can also make the next forecast more trustworthy.
Hold
Hold when the target depends on an unrealistic CAC, the economics cannot fund the payback period, the data cannot support the decision or the operational system cannot serve additional customers well.
Holding additional spend is not a failure. It protects capital until the business can identify and improve the actual constraint.
Build a monthly planning cadence
Marketing budgeting should be a repeatable operating process rather than an annual percentage chosen once and left unchanged.
At the end of each completed month:
reconcile acquisition spend with finance;
confirm the number and definition of newly acquired customers;
update revenue per acquired customer using a consistent cohort window;
compare actual CAC and revenue with the prior Base and Conservative cases;
decide whether to scale, stage, improve or hold the next increment.
Track both average and marginal performance. Average CAC explains what the existing budget produced. Marginal CAC asks what the next portion of spend produced. A blended average can remain attractive even while the newest budget increment is already becoming inefficient.
The planning cadence should also record why performance changed. Spend alone is rarely the full explanation. Creative, offer, pricing, channel mix, seasonality, conversion rate, sales capacity and customer quality may all influence the result.
When a model is not enough
An internal team can usually build a useful first plan when customer definitions are consistent, acquisition spend is reconciled, the target is within a familiar range and someone owns monthly validation.
Specialist support becomes more valuable when:
several products, markets or channels require separate economics;
CAC and revenue differ materially across analytics, CRM and finance;
offline sales or long sales cycles break acquisition continuity;
the budget increase moves far beyond historical spend;
LTV, margin or payback materially constrain the decision;
leadership needs an independent review before making a high-stakes allocation.
The goal is not a more complicated spreadsheet. It is a decision system that connects the revenue target, acquisition model, customer economics, measurement quality and operating plan.
Frequently asked questions
How much marketing budget do I need to hit a revenue target?
Start with the latest completed month. Divide acquisition spend by CAC to estimate acquired customers, multiply those customers by comparable revenue per customer, apply the growth target, and calculate the customer volume required. Then translate that volume into a budget under several CAC scenarios rather than assuming efficiency will remain flat.
Should marketing budget be based on current revenue or target revenue?
Use current performance to establish the baseline and the target to define the gap. A percentage of current or target revenue can be a broad benchmark, but a bottom-up budget should be based on the customers, CAC and revenue per acquired customer required to close that gap.
Can I forecast revenue directly from marketing spend?
You can create a planning forecast when spend, CAC and revenue per acquired customer use comparable definitions. The result remains conditional on the assumptions. It is not proof that spend alone causes the forecast revenue, and it should not be treated as a guarantee.
What if CAC increases when the budget increases?
Use a Conservative scenario and stage the increase. Monitor marginal CAC, customer quality and revenue after each increment. If the new evidence is weaker than the approved boundary, revise or pause the plan rather than protecting the original forecast.
How often should I update the marketing budget forecast?
For an active growth plan, update it after each completed month and after any material change in pricing, offer, channel mix, conversion rate, attribution, sales process or market conditions. Avoid rebuilding the model from partial-month data unless the business explicitly needs an in-period diagnostic.
From a revenue target to a funded growth decision
The strongest marketing budget is not the one that matches an industry percentage. It is the one whose assumptions can be traced from spend to customers, from customers to revenue, and from revenue to sustainable economics.
Start with the latest completed month. Define the revenue target. Work backward to the customer requirement. Test how CAC and revenue may change. Then choose whether to scale, stage, improve or hold.
That process turns “How much should we spend?” from a negotiation into a measurable growth decision.
Turn the revenue target into a funded growth decision
Model the budget range, pressure-test the economics and make the next allocation decision with explicit assumptions rather than a generic percentage benchmark.
A practical guide to using marketing-spend percentages as a guardrail—then replacing them with CAC, margin, payback and revenue-target math when growth decisions get real.
A practical guide to CAC, LTV and payback that separates decision-grade unit economics from misleading averages—so growth leaders know when to scale, investigate or stop spend.
A practical GA4 audit framework for finding tracking, attribution, revenue and data-quality problems — and prioritising the issues that can damage business decisions.