Growth Strategy
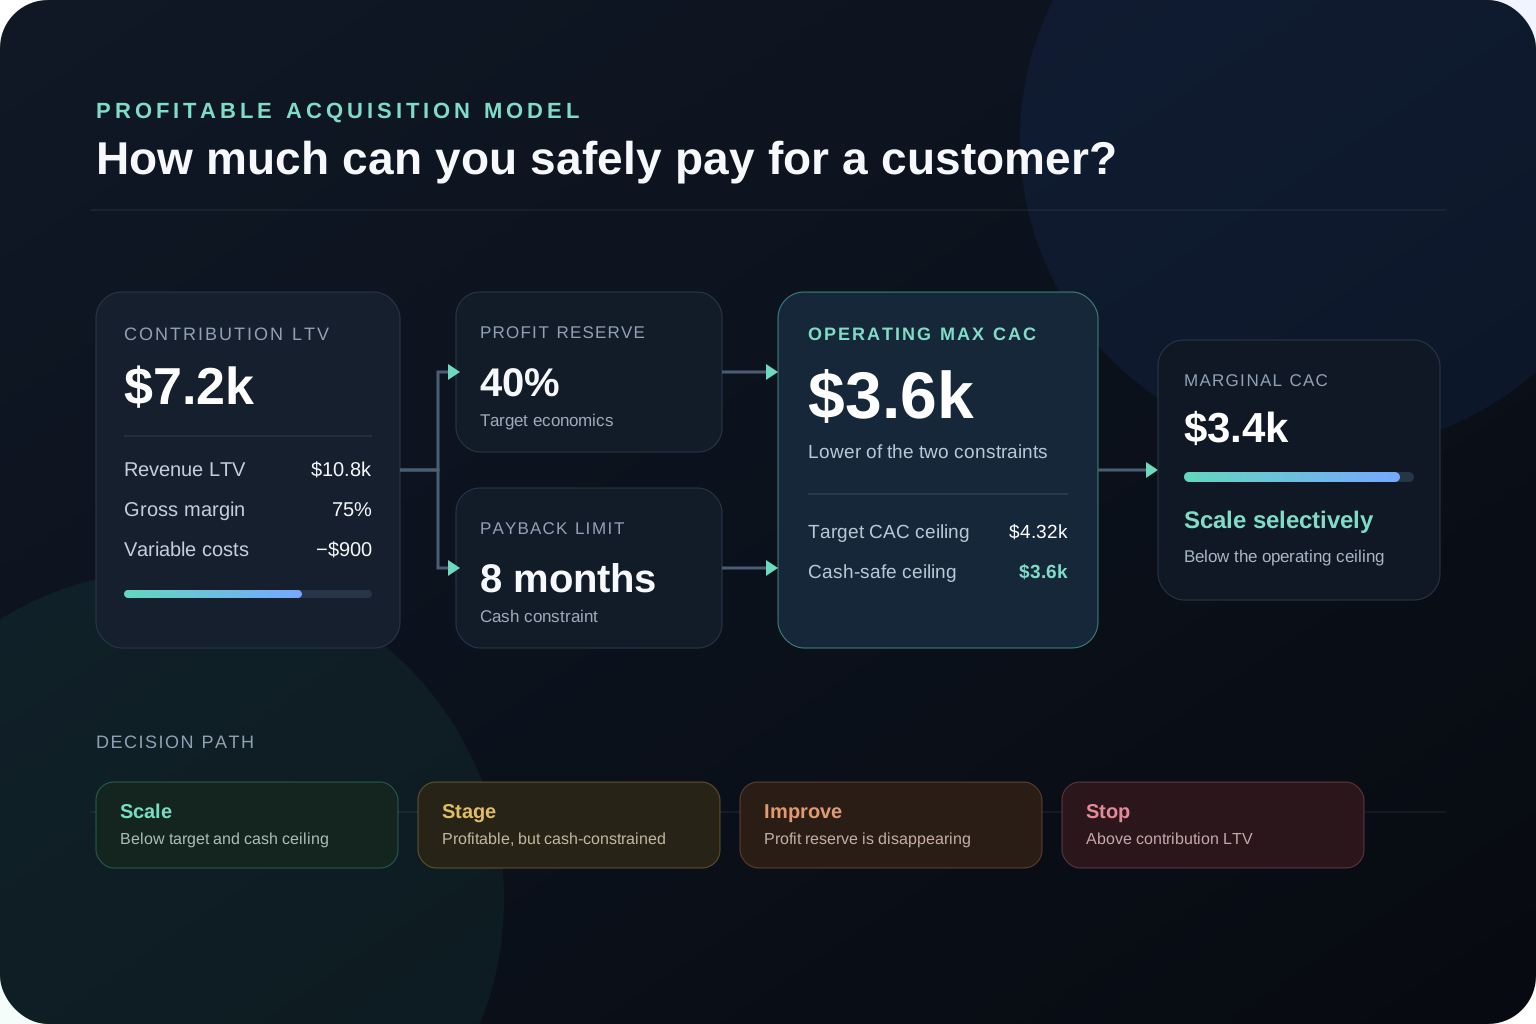
Maximum CAC: How Much Can You Afford to Pay for a Customer?
A commercial framework for calculating maximum profitable CAC, protecting payback and deciding whether acquisition spend is ready to scale.
Read articleShare
A commercial framework for calculating the ROAS your margins actually require — and deciding whether reported performance is strong enough to justify the next increase in ad spend.
A 4× ROAS can be excellent for one business and loss-making for another. The number tells you how much attributed revenue advertising generated for each unit of ad spend. It does not tell you how much of that revenue remains after the product, fulfilment, payment, returns, service and other variable costs are paid.
That is why founders, CMOs and Heads of Growth should not ask only, “Is our ROAS good?” The commercially useful question is:
What ROAS does our cost structure require, and will the next increase in ad spend remain above that threshold?
This guide shows how to calculate a profitable ROAS from contribution margin, establish a target above break-even, reconcile the result with CAC and LTV, and turn it into a Scale, Stage, Fix or Reallocate decision.
Begin with net revenue and subtract the variable costs required to deliver that revenue. The amount left before advertising is the contribution available to fund ad spend and the profit reserve required by the business.
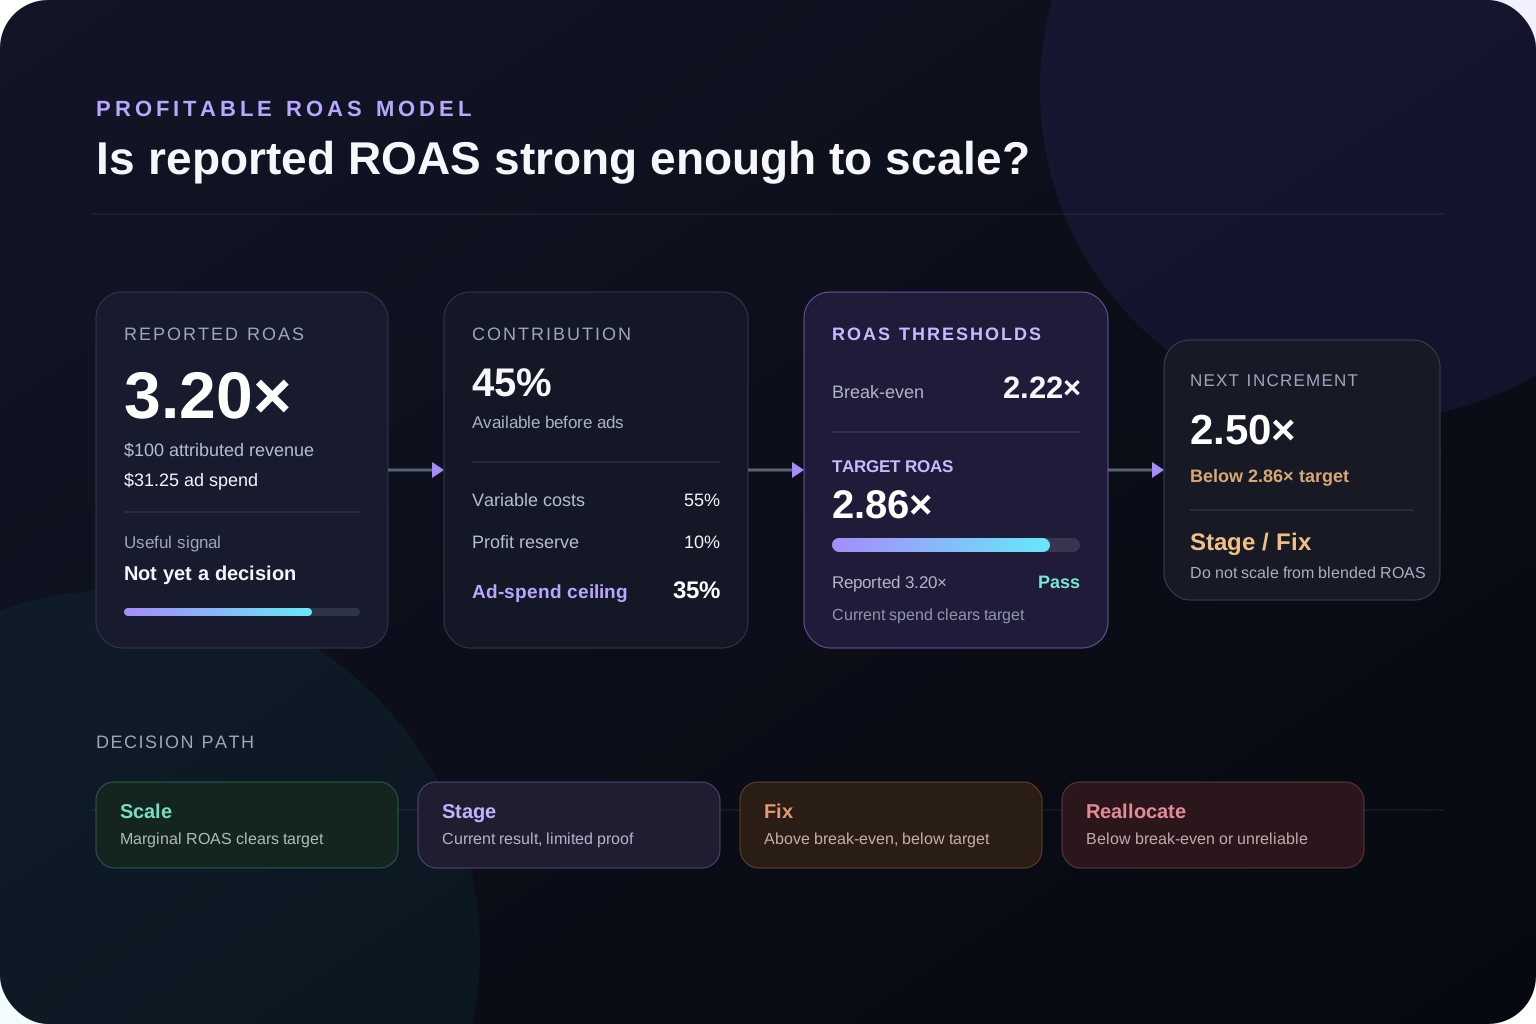
If the pre-ad contribution margin is 45%, the simplified break-even ROAS is:
Break-even ROAS = 1 ÷ 45% = 2.22×
At 2.22×, advertising consumes the full $45 contribution generated by each $100 of net revenue. The order covers its included variable costs and ad spend, but it leaves no contribution for fixed overhead, reinvestment, uncertainty or profit.
If the business wants to retain 10% of revenue after advertising, only 35% remains available for ad spend:
Target ROAS = 1 ÷ (45% − 10%) = 2.86×
ROAS is calculated as attributed advertising revenue divided by ad spend. A reported ROAS of 3× means the platform or analytics system assigns $3 of revenue to every $1 spent on advertising.
Profitability begins only when that ratio is compared with the economics of the revenue underneath it. A decision-grade profitable ROAS should satisfy three conditions:
This is why there is no universal profitable ROAS benchmark. A low-margin retailer may need more than 4× to protect contribution. A high-margin digital business may create attractive economics below 2×. The right number comes from the business model, not an industry screenshot.
A useful ROAS decision can be built as four connected layers. Each layer answers a different management question and prevents a common shortcut.
Platform-reported ROAS belongs only to the first layer. It is a useful input, but it cannot authorize a budget increase until the other three layers are explicit.
| Input | What it should represent | Preferred source | Common error |
|---|---|---|---|
| Net attributed revenue | Comparable revenue excluding tax and adjusted for discounts, cancellations and expected returns | Analytics reconciled with orders or billing | Using platform conversion value as final revenue truth |
| Variable product or service cost | Cost that changes when the order, customer or transaction is delivered | Finance and operations | Using gross revenue as if it were available for ads |
| Transaction and fulfilment cost | Payment fees, picking, shipping, support and other incremental costs not already included | Payment, logistics and service systems | Omitting small costs that materially reduce a thin margin |
| Required post-ad contribution | Amount retained for fixed costs, reinvestment, uncertainty and profit | Operating plan | Treating break-even as the desired target |
| Marginal performance | ROAS, CAC and customer mix produced by the newest spend increment | Staged budget or spend-response analysis | Assuming historical blended ROAS will persist at scale |
Use revenue that matches the advertising and decision window. Exclude sales tax or VAT collected for the government. Apply realised discounts and a defensible allowance for cancellations, refunds and returns when they are not yet fully observed.
Subtract the variable costs required to deliver the revenue, but do not subtract advertising yet:
Pre-ad contribution = net revenue − variable costs before advertising
Divide that amount by net revenue to calculate the pre-ad contribution margin. The definition must be consistent across products, channels and periods if the resulting ROAS thresholds will be compared.
Break-even ROAS = 1 ÷ pre-ad contribution margin
This simplified threshold assumes the included contribution can be fully consumed by advertising. It is useful as a red line, not as the operating target.
Subtract the post-ad contribution margin the business intends to retain:
Target ROAS = 1 ÷ (pre-ad contribution margin − required post-ad contribution margin)
The reserve should reflect the actual operating plan. Choosing it is a management decision, not a media-platform setting. If the remaining margin is zero or negative, the current offer cannot fund both advertising and the required contribution.
Consider a business with the following economics for one comparable order:
The pre-ad contribution is $45, or 45% of net revenue. Break-even ROAS is therefore 2.22×. Preserving $10 after advertising leaves a maximum ad spend of $35 per $100 of revenue, producing a target ROAS of 2.86×.
The same reported ROAS can create profit or destroy it. The difference is the contribution margin available before advertising and the amount the business must retain after acquisition.
Net order revenue
$100
After discounts, tax and expected returns
Variable costs
−$55
Product, fulfilment, payment and service costs
Pre-ad contribution
$45
45% contribution margin before advertising
Break-even ROAS
2.22×
$100 revenue ÷ $45 maximum break-even ad spend
Target ROAS
2.86×
$35 ad ceiling after preserving $10 contribution
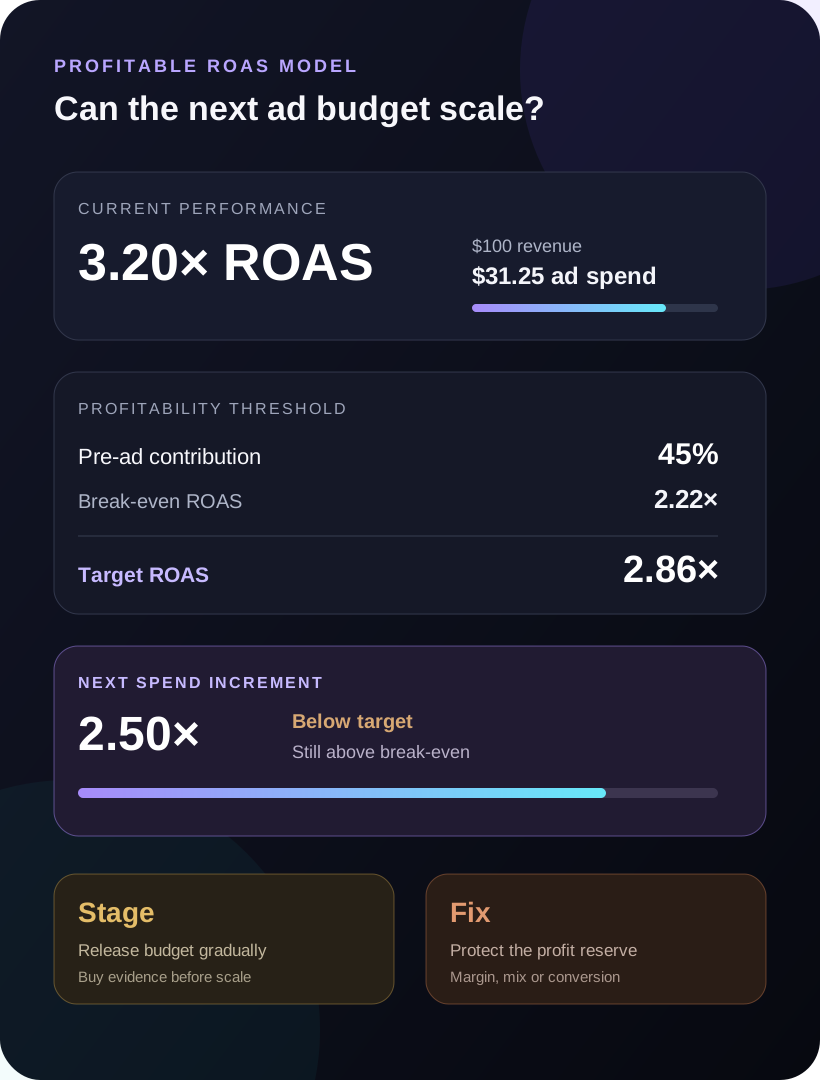
At a reported 3.2× ROAS, each $100 of attributed revenue requires $31.25 in ad spend. After $55 of variable costs, the order retains $13.75. On these simplified economics, the campaign clears the $10 target reserve.
The correct decision is still not “scale without limit.” If the next budget increment generates only 2.5×, it requires $40 of ad spend per $100 of revenue and retains only $5. The new spend remains above simplified break-even but falls below the business target.
The historical 3.2× answers whether the existing spend met the threshold. The marginal 2.5× answers whether the next spend increment deserves more capital.
The objective is not to force every company expense into one order-level formula. It is to prevent advertising from consuming contribution the business needs elsewhere.
Include costs that vary materially with the measured revenue, such as:
Fixed salaries, rent and platform subscriptions may not belong in the variable cost per order. But they cannot be ignored. Protect them through the required post-ad contribution reserve or through a separate operating profitability view.
Avoid mixing definitions. If agency and creative costs are added to ad spend for one channel but excluded for another, the ROAS comparison is no longer like-for-like. Record a media-only threshold and a fully loaded paid-growth threshold separately when both decisions matter.
A high ROAS can coexist with weak business profitability for several reasons. The most common is low contribution margin: the revenue multiple looks strong while little revenue remains available for advertising.
Other failure modes include:
The reverse is also possible. A lower front-end ROAS can support an attractive growth decision when the acquired cohort has proven repeat contribution, cash recovers within an acceptable window and the measurement system does not understate assisted or offline revenue. That exception must be demonstrated through customer economics, not assumed to protect a weak campaign.
Google Ads, Meta Ads, analytics, ecommerce and finance systems can all show different versions of advertising revenue. Attribution windows, modelling, consent, time zones, refunds, currency and cross-device behaviour can create legitimate differences.
The systems do not need to match perfectly. They do need to be reconciled well enough that leadership knows which number is being used and what it can support.
A practical reconciliation has three views:
When Google Ads and GA4 report different conversion totals, use the GA4 vs Google Ads conversion reconciliation framework before changing budget. Its role is measurement diagnosis; this article has the narrower commercial role of turning reconciled revenue and margin into a profitable ROAS threshold.
If paid acquisition, customer identity, CRM outcomes and revenue cannot be connected reliably, review the analytics infrastructure required to evaluate spend against real business outcomes.
ROAS, CAC and LTV are related, but they should not be treated as competing labels for the same decision.
For a one-order, new-customer campaign, ROAS and CAC can be translated through average order value. But many platform ROAS reports mix new and returning buyers, while CAC should count newly acquired customers only. That difference can make a channel look efficient without growing the customer base profitably.
LTV can justify accepting a lower front-end ROAS when repeat contribution is proven and payback remains fundable. Use cohort evidence and keep actual front-end revenue separate from projected lifetime value.
The maximum profitable CAC framework owns the customer-level question: how much can the business afford to pay for the next customer? This article owns the revenue-efficiency question: what ROAS threshold should the paid program clear before more budget is released?
Use the Predictive LTV & Payback tool when repeat behaviour, retention and cash recovery materially change the acquisition decision.
Blended ROAS describes the average result across the current spend and revenue base. Marginal ROAS estimates the revenue created by the next portion of spend. The marginal number is usually more relevant when deciding whether to scale ads profitably.
ROAS often falls as spend expands into weaker audiences, more expensive auctions or lower-intent inventory. It can also fall when creative fatigue, landing-page constraints, slow sales follow-up, inventory limits or a change in product mix reduces conversion quality.
A lower ROAS at higher spend is not automatically a failure. Total contribution can rise even when the efficiency ratio falls. The right question is whether the additional revenue generated by the additional spend still clears the target contribution threshold.
Before increasing the budget:
The marketing budget for a revenue target framework shows how to translate customer volume and CAC scenarios into a staged spend range. ROAS becomes one validation layer inside that broader budget decision.
You can also use the Marketing Budget & Growth Planner to pressure-test the next budget against Conservative, Base and Upside acquisition scenarios.
A profitable ROAS calculation should end with an operating decision, not a prettier performance report.
A profitable historical average is the start of the decision. Budget should expand only when the next increment still protects contribution and the revenue signal is decision-ready.
Below 2.22×
Fix or stop
Ad spend exceeds the pre-ad contribution available from the measured revenue.
2.22×–2.86×
Hold and improve
The campaign clears simplified break-even but misses the required profit reserve.
At or above 2.86×
Stage the next budget
Target economics are met; validate customer mix and marginal performance before scaling.
Target holds at higher spend
Scale selectively
The next spend increment remains profitable after attribution and cohort-quality checks.
| Evidence | Commercial interpretation | Decision | Next proof required |
|---|---|---|---|
| Actual and marginal ROAS exceed target | Current contribution and the newest spend increment meet the required economics | Scale selectively | Confirm the threshold still holds after the next increment |
| Actual ROAS exceeds target; marginal evidence is limited | The existing program works, but extrapolation risk is high | Stage | Run a controlled budget increase and monitor customer mix |
| ROAS is above break-even but below target | Advertising covers included variable costs but underfunds the required reserve | Fix or constrain | Improve offer, margin, conversion, mix or acquisition efficiency |
| ROAS is below break-even or revenue is unreliable | The program destroys included contribution or cannot be evaluated safely | Reallocate or hold | Correct economics or measurement before releasing more budget |
Scale when both current and marginal performance clear the target, the acquired customer mix remains acceptable and the business can fulfil the additional demand. Continue in stages with pre-agreed monitoring and stop conditions.
Stage when current ROAS is profitable but the proposed increase is large, historical evidence is thin or the next audience is materially different. Buy evidence before buying the full growth plan.
Fix before scaling when the program clears break-even but misses target. Margin, pricing, product mix, conversion rate, creative, sales follow-up or fulfilment may offer more leverage than another round of bid adjustments.
Reallocate or hold when ROAS remains below break-even, when the weakest products consume the budget, or when the revenue signal cannot support the decision. Move capital toward a better segment or fix the measurement and economics first.
Before approving additional ad spend, verify that:
The calculation can be handled internally when the business has comparable order economics, reconciled revenue and a modest budget decision. A broader review becomes valuable when products, markets, sales cycles or customer cohorts have materially different economics.
Unit Economics & Growth Strategy connects ROAS, CAC, contribution margin, LTV and payback into one investment model. A Growth Audit is more appropriate when the question includes funnel performance, measurement reliability and prioritisation across several constraints.
The Mental Health Marketing Analytics case study shows why acquisition decisions become stronger when channel performance is evaluated beside activation, retention and customer value rather than as an isolated media ratio.
Calculate net revenue, subtract the variable costs required to deliver it, and divide the remaining pre-ad contribution by net revenue. Break-even ROAS is one divided by that margin. To calculate target ROAS, first subtract the contribution margin the business wants to retain after advertising.
Divide one by the pre-ad contribution margin. A 50% margin produces a 2× simplified break-even ROAS; a 40% margin produces 2.5×; a 25% margin produces 4×. Confirm which costs are included before using the result.
ROAS measures attributed revenue, not net profit. Low margin, returns, fulfilment, transaction costs, repeat-customer credit, duplicated attribution or costs outside the platform can consume the apparent return.
Start with the pre-ad contribution margin rather than a generic gross-margin label. Subtract the post-ad contribution the business needs to retain, then divide one by the remaining margin available for ad spend.
A lower pre-ad contribution margin leaves less revenue available for advertising, so the business needs a higher ROAS to break even. A higher margin creates more room for ad spend, but the target should still preserve the contribution required after advertising.
Reconcile the platform-attributed revenue with analytics, orders and finance, then compare the resulting ROAS with the break-even and target thresholds derived from your costs. Do not use a platform colour, generic benchmark or bidding recommendation as proof of business profitability.
Use ROAS to evaluate revenue efficiency in a defined window and CAC to evaluate the cost of acquiring a new customer. Check both when returning customers, order frequency or customer quality vary by channel. Add LTV and payback when value arrives after the first transaction.
Yes, when the additional spend still produces contribution above the target and increases total profit at an acceptable risk and payback. A lower ratio can be commercially better than a high ROAS on very little spend. Evaluate marginal revenue and contribution rather than defending one historical efficiency number.
Profitable ROAS is not a universal benchmark and it is not whatever number the advertising platform colours green. It is a threshold derived from net revenue, contribution economics and the profit the business intends to keep.
Start with revenue truth. Calculate break-even. Add the required reserve. Compare the resulting target with actual and marginal performance. Then choose whether to Scale, Stage, Fix or Reallocate.
That sequence turns ROAS from a reporting metric into a capital-allocation rule — and makes the next marketing budget easier to defend.
Ready to pressure-test the next budget? Build a risk-adjusted marketing budget range.
Need to connect ROAS, CAC, customer value and measurement across products or channels? Discuss the growth decision or review Unit Economics & Growth Strategy.
Share this article
Next step
Model the customer volume, CAC scenarios and revenue range behind the next budget increase instead of approving spend from one historical ROAS number.
Related
A commercial framework for calculating maximum profitable CAC, protecting payback and deciding whether acquisition spend is ready to scale.
Read article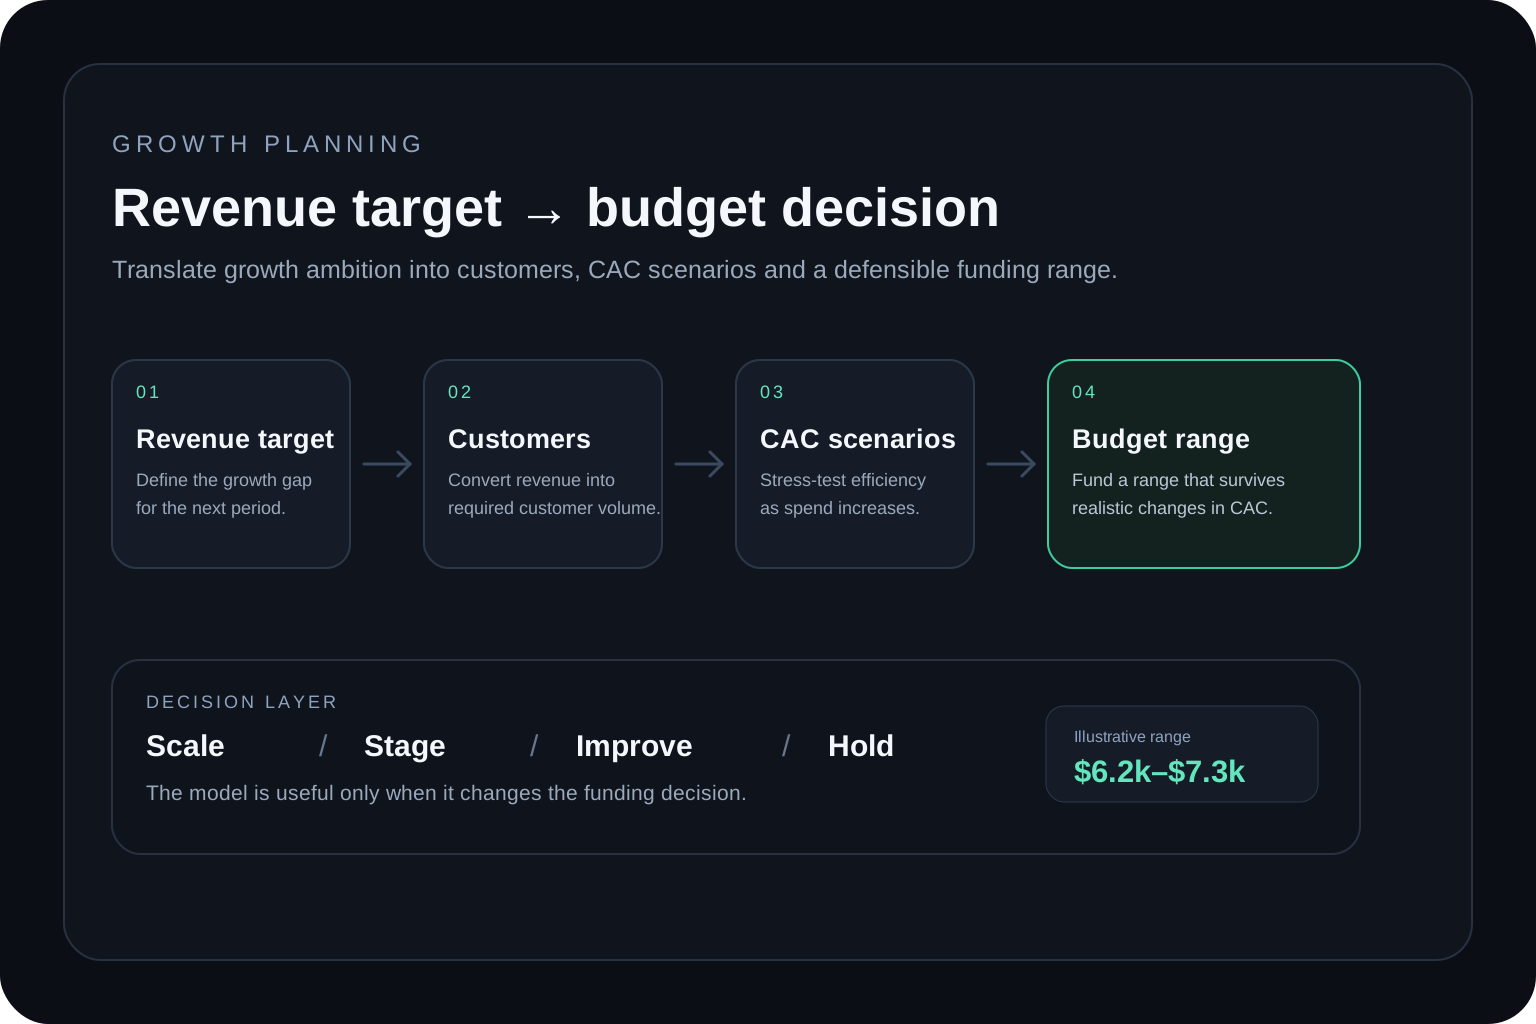
A practical framework for turning a revenue target into a defensible marketing budget using customer volume, CAC scenarios, unit economics and decision-ready data.
Read article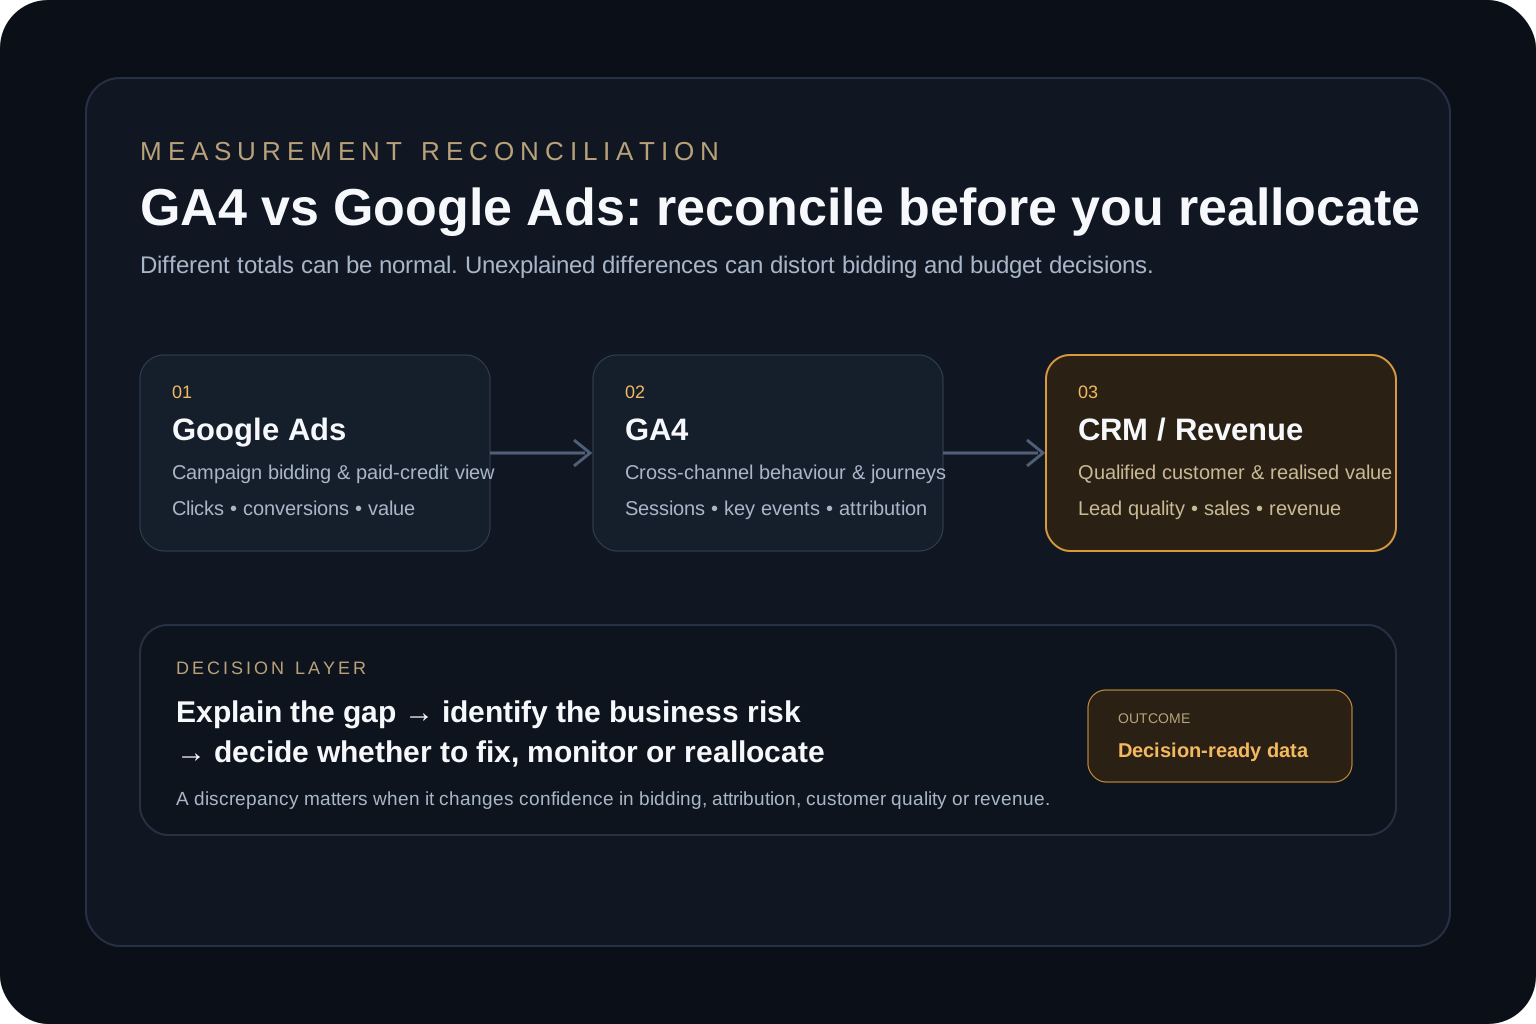
A decision-first audit framework for diagnosing GA4 and Google Ads conversion discrepancies before they distort bidding, attribution and budget allocation.
Read article