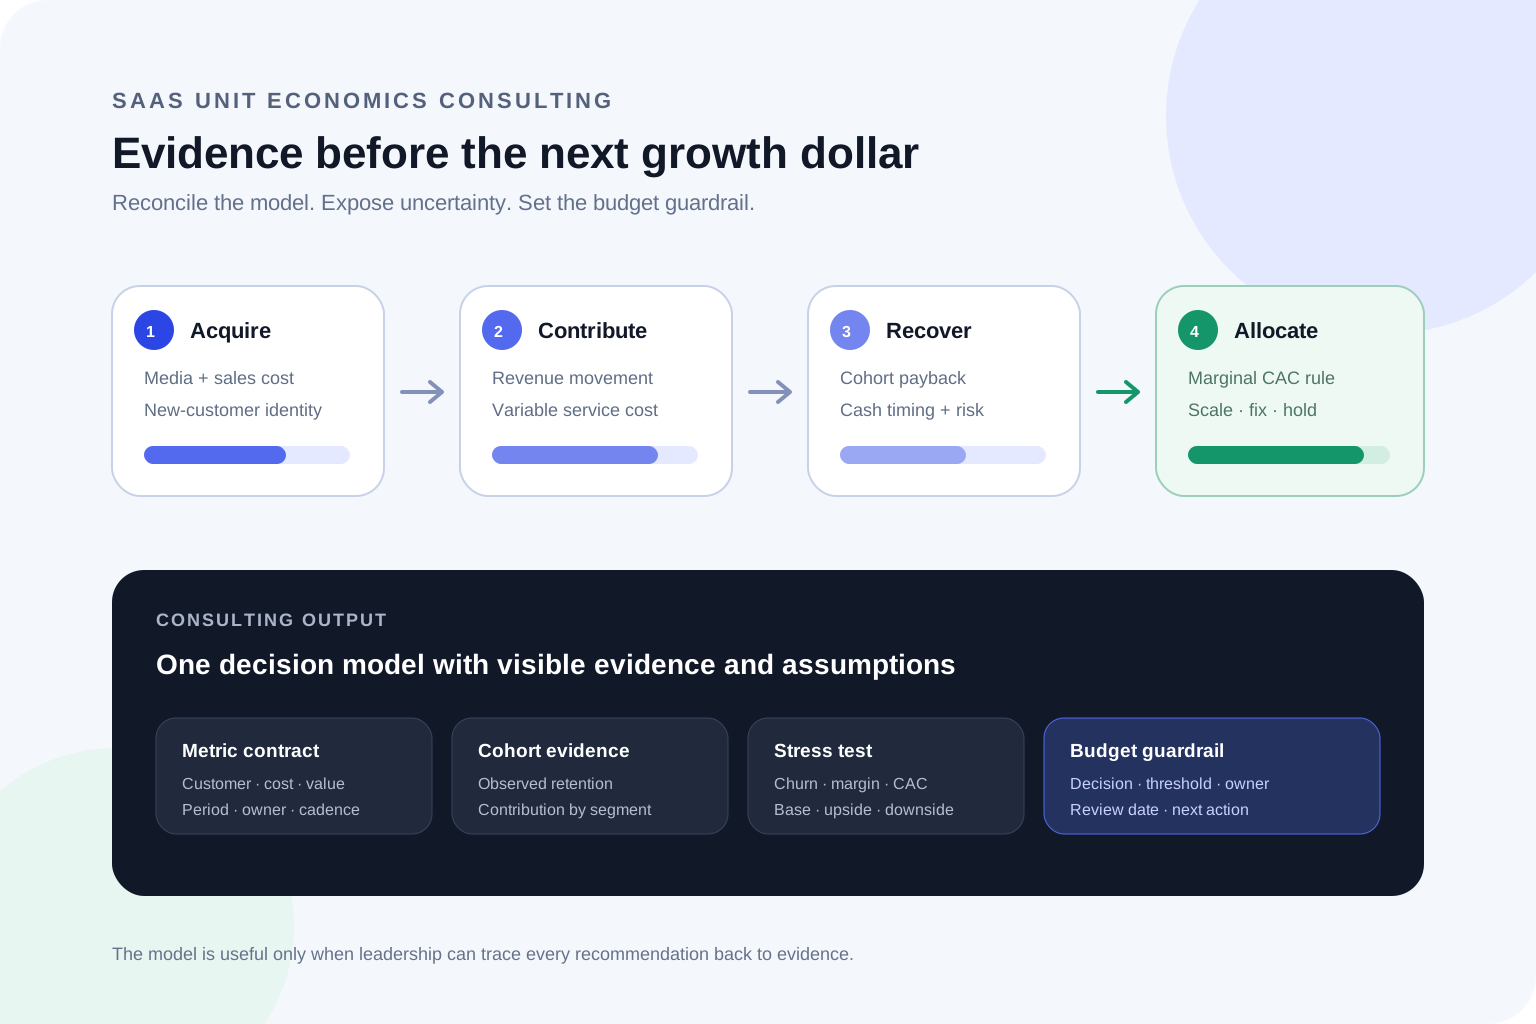
Unit Economics
SaaS Unit Economics Consultant: CAC, LTV & Payback Before Scaling
A buyer's guide to SaaS unit economics consulting: scope, data, deliverables, cost drivers and the CAC, LTV and payback evidence needed before scaling.
Read articleShare
Apparently strong unit economics can still push a business toward the wrong growth decision.
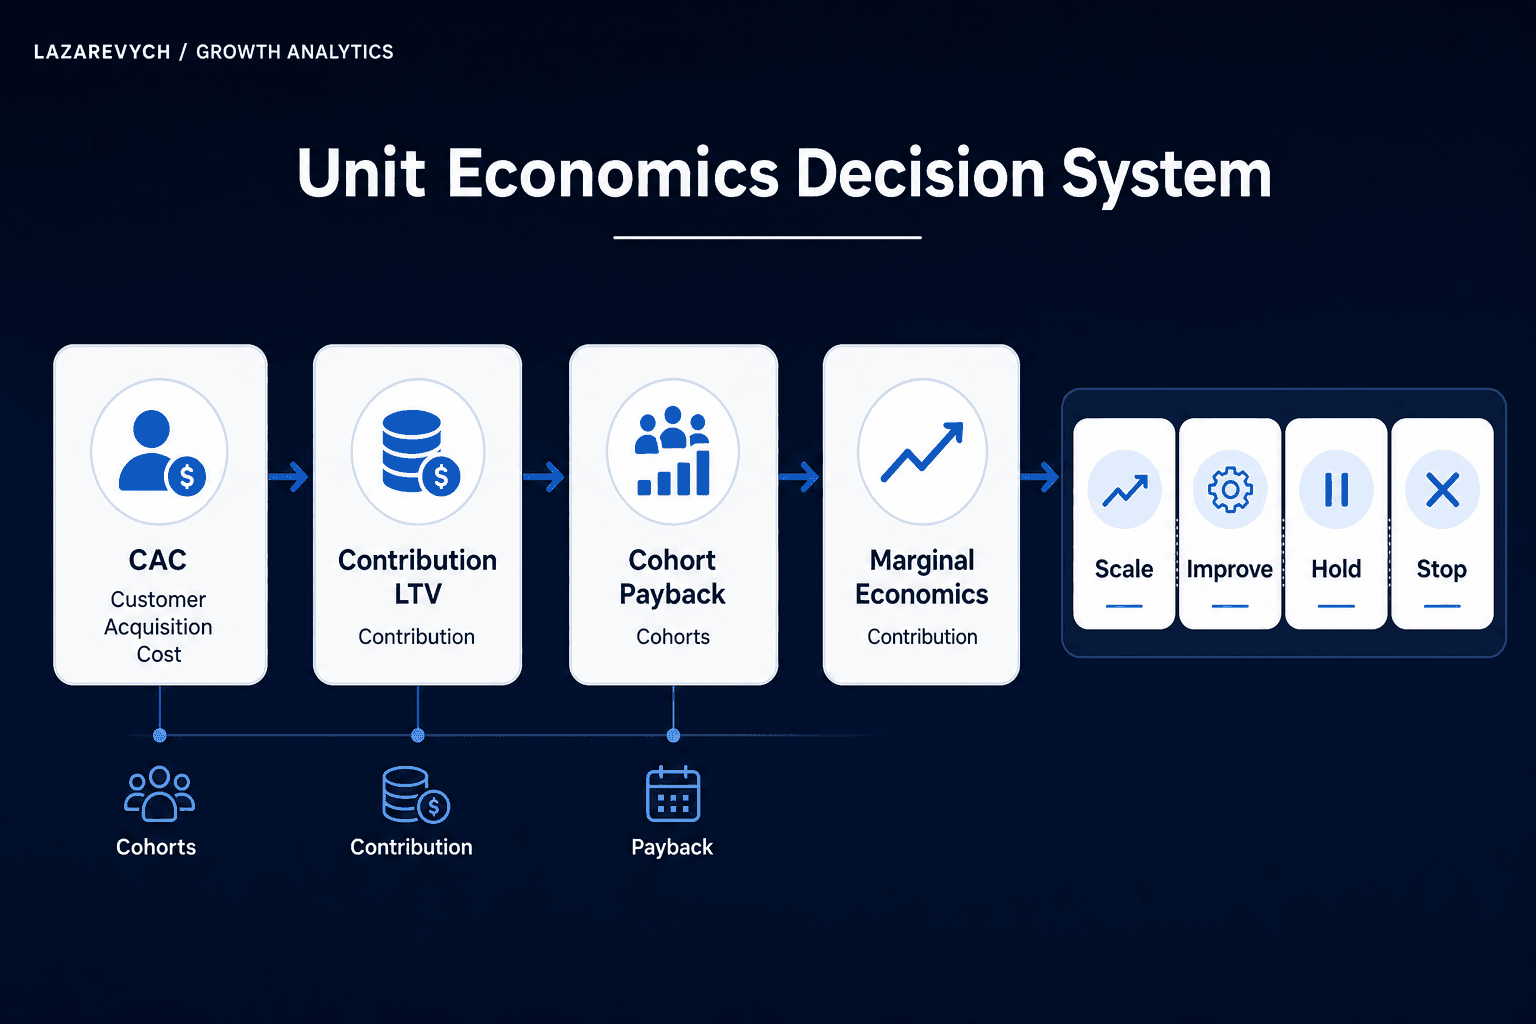
Apparently strong unit economics can still push a business toward the wrong growth decision. This is how CAC can increase while revenue grows, or LTV can look high while cash flow remains weak.
CAC may look stable because organic customers are mixed with paid acquisition. LTV may look attractive because it is based on revenue rather than contribution. Payback may appear fast because refunds, servicing costs or credit losses are missing. A blended LTV:CAC ratio can look healthy while the next budget increment is already unprofitable.
The purpose of a useful unit economics model is not to produce a reassuring ratio. It is to answer four executive questions:
This guide explains how to calculate CAC, LTV and CAC payback period in a way that supports those decisions—without turning the analysis into an accounting textbook.
A decision-grade model connects acquisition cost to realised customer contribution over time.
It must use compatible definitions. If CAC includes only media spend while LTV includes years of revenue, the comparison is structurally biased. If CAC is calculated from this month’s spend but LTV comes from mature customers acquired two years ago, the model mixes different market conditions, pricing, retention and channel quality.
Reliable unit economics should prove three things:
| Metric | What it measures | Decision it supports | What it cannot prove alone |
|---|---|---|---|
| Paid CAC | Media cost per paid-acquired customer | Compare paid channels on a narrow basis | Total commercial cost or incrementality |
| Blended CAC | Total acquisition spend divided by all new customers | Portfolio-level acquisition efficiency | Which channel or segment is deteriorating |
| Fully loaded CAC | Agreed acquisition costs per new customer | Investment-grade cost of growth | Whether future spend will perform like the average |
| Contribution LTV | Expected lifetime contribution after relevant variable costs | How much economic value a customer can support | How quickly the cash is recovered |
| CAC payback period | Time until cumulative contribution covers CAC | Cash efficiency and growth capacity | Full lifetime profitability |
| LTV:CAC | Contribution value relative to acquisition cost | High-level screening and comparison | Timing, risk, cohort maturity or marginal returns |
The most important principle is simple: do not compare metrics until their customer definition, time period, cost scope and value basis match. For leadership, that means one reconciled view of cost, value, timing, risk and the next action.
The basic customer acquisition cost calculation is:
CAC = acquisition cost ÷ new customers acquired
The arithmetic is easy. The scope is not.
Paid CAC usually divides media spend by customers attributed to paid channels. It is useful for campaign management, but it is not the complete cost of acquiring a customer.
Blended CAC divides total acquisition spend by all new customers, including organic or referral-driven customers. It helps leadership understand the average acquisition burden across the business, but it may hide channel-level losses.
Fully loaded CAC includes the costs that the company has explicitly agreed are necessary to create new customers. Depending on the model, this may include media, sales commissions, acquisition tooling, agency fees, promotional incentives and a relevant share of sales or marketing payroll.
Fully loaded CAC = agreed acquisition costs ÷ new customers
There is no universal list of costs that every company must include. What matters is consistency and decision relevance. A board-level capital allocation model may need a broader CAC than a performance marketing dashboard.
Advertising platforms optimise around attributed conversions. That does not automatically make platform CPA equal to customer acquisition cost.
The gap can come from:
When acquisition decisions depend on trustworthy measurement, the first step is often a GA4 audit checklist for tracking and attribution quality, not a new spreadsheet formula.
A single company-wide CAC is rarely enough. Break it down by the dimensions that can change the investment decision:
A business can have an acceptable blended CAC while a new geography, partner or channel is destroying contribution. Segmentation reveals whether growth is broad-based or subsidised by one strong customer group.
Lifetime value is often presented as one number, but several different metrics are commonly called LTV.
Revenue LTV estimates lifetime revenue per customer. It is useful for sizing, but revenue cannot pay back acquisition cost if the business has meaningful fulfilment, servicing, payment, support, refund or credit-risk costs.
Gross-margin-adjusted LTV removes cost of goods sold or equivalent delivery costs:
Gross-margin-adjusted LTV = revenue LTV × gross margin
Contribution-margin LTV goes further and removes the variable costs required to serve, retain and monetise the customer:
Contribution LTV = expected lifetime revenue − relevant variable customer costs
Relevant costs depend on the business model.
For SaaS, they may include payment processing, variable infrastructure, customer support and usage-based third-party fees. For ecommerce, they may include fulfilment, shipping subsidies, returns, payment fees and loyalty incentives. For FinTech or lending, contribution may also need to reflect funding costs, servicing, fraud, defaults and recoveries.
Historical cohort LTV is based on realised behaviour. It is slower but easier to verify.
Predicted LTV estimates future contribution using assumptions about retention, repeat purchases, expansion, churn, margin or default. It is useful for faster decisions, but its quality depends on model stability and cohort maturity.
The safest operating model uses both:
For a stable subscription business, a simplified LTV formula based on average revenue and churn can be directionally useful. It becomes unreliable when:
Use the simple formula as a teaching model, not as automatic permission to scale.
The CAC payback period answers a different question from LTV:
How long does it take for a customer’s cumulative contribution to repay the cost of acquiring that customer?
Payback period = the first period in which cumulative contribution is equal to or greater than CAC
For a simple, stable subscription model, teams sometimes approximate payback as CAC divided by monthly contribution per customer. Cohort-based calculation is stronger because contribution can change over time.
Consider a hypothetical SaaS cohort with a fully loaded CAC of $900. Monthly contribution grows as customers complete onboarding and expand usage:
The cohort reaches payback during month six.
Cumulative Contribution vs CAC
Illustrative example based on a hypothetical business. Not an industry benchmark.
Payback matters because two customers with the same LTV can create very different growth constraints. A customer who returns acquisition cash in four months can often support faster reinvestment than one who returns it in eighteen months—even if their eventual lifetime contribution is identical.
But a shorter payback is not automatically better. A longer-payback segment can still be attractive when retention is strong, contribution is predictable and the company has sufficient capital. The correct target depends on cash availability, margin, risk and the reliability of the forecast.
This is why payback by cohort, channel and segment is more useful than one company-wide average.
The LTV to CAC ratio is commonly calculated as:
LTV:CAC = contribution LTV ÷ compatible CAC
The word compatible matters.
A contribution-based LTV should not be compared with a narrow media-only CAC when the decision concerns total acquisition investment. A predicted LTV from retained customers should not be compared with CAC from a new experimental market without adjusting for the difference in risk.
A high ratio may indicate:
A low ratio may indicate:
There is no universal ratio that defines a healthy company. A “3:1 rule” may be a useful conversation starter in some subscription contexts, but it is not a law. The same ratio can imply very different outcomes depending on payback timing, cash constraints, cohort trend and forecast risk.
Use LTV:CAC as a screening metric. Make the actual investment decision with payback, contribution, retention, cohort quality and marginal economics beside it.
Average metrics combine customers acquired under different conditions. Cohort analysis separates them.
Useful cohort cuts include:
For each cohort, track the path—not only the final ratio:
A customer is not valuable only because revenue is booked.
Revenue quality depends on whether it is retained, collected and delivered with acceptable variable cost. A promotional ecommerce cohort may acquire cheaply but return products frequently. A SaaS cohort may convert well but require high-touch support. A FinTech cohort may generate interest revenue while default risk erodes contribution.
The question is not only “How much revenue did this cohort create?” It is:
How much reliable contribution did the cohort create, how quickly, and with what uncertainty?
Historical CAC describes what the business has already achieved. Marginal CAC estimates the cost of acquiring the next customers from an additional budget increment.
Marginal CAC = incremental acquisition cost ÷ incremental customers
Suppose a channel has spent $100,000 and acquired 400 customers. Its average CAC is $250.
The team adds another $25,000 and receives only 50 incremental customers. The marginal CAC is $500.
The historical average still looks acceptable, but the next budget increment is twice as expensive.
This deterioration can happen because:
Blended CAC vs Marginal CAC by Acquisition Channel
Google Search
Meta
Illustrative example based on a hypothetical business. Not an industry benchmark.
This is the core answer to “How do we know when to scale acquisition?”
Do not ask only whether the channel’s average CAC is below target. Ask whether the incremental customers are expected to generate enough contribution, within an acceptable payback period, after accounting for uncertainty.
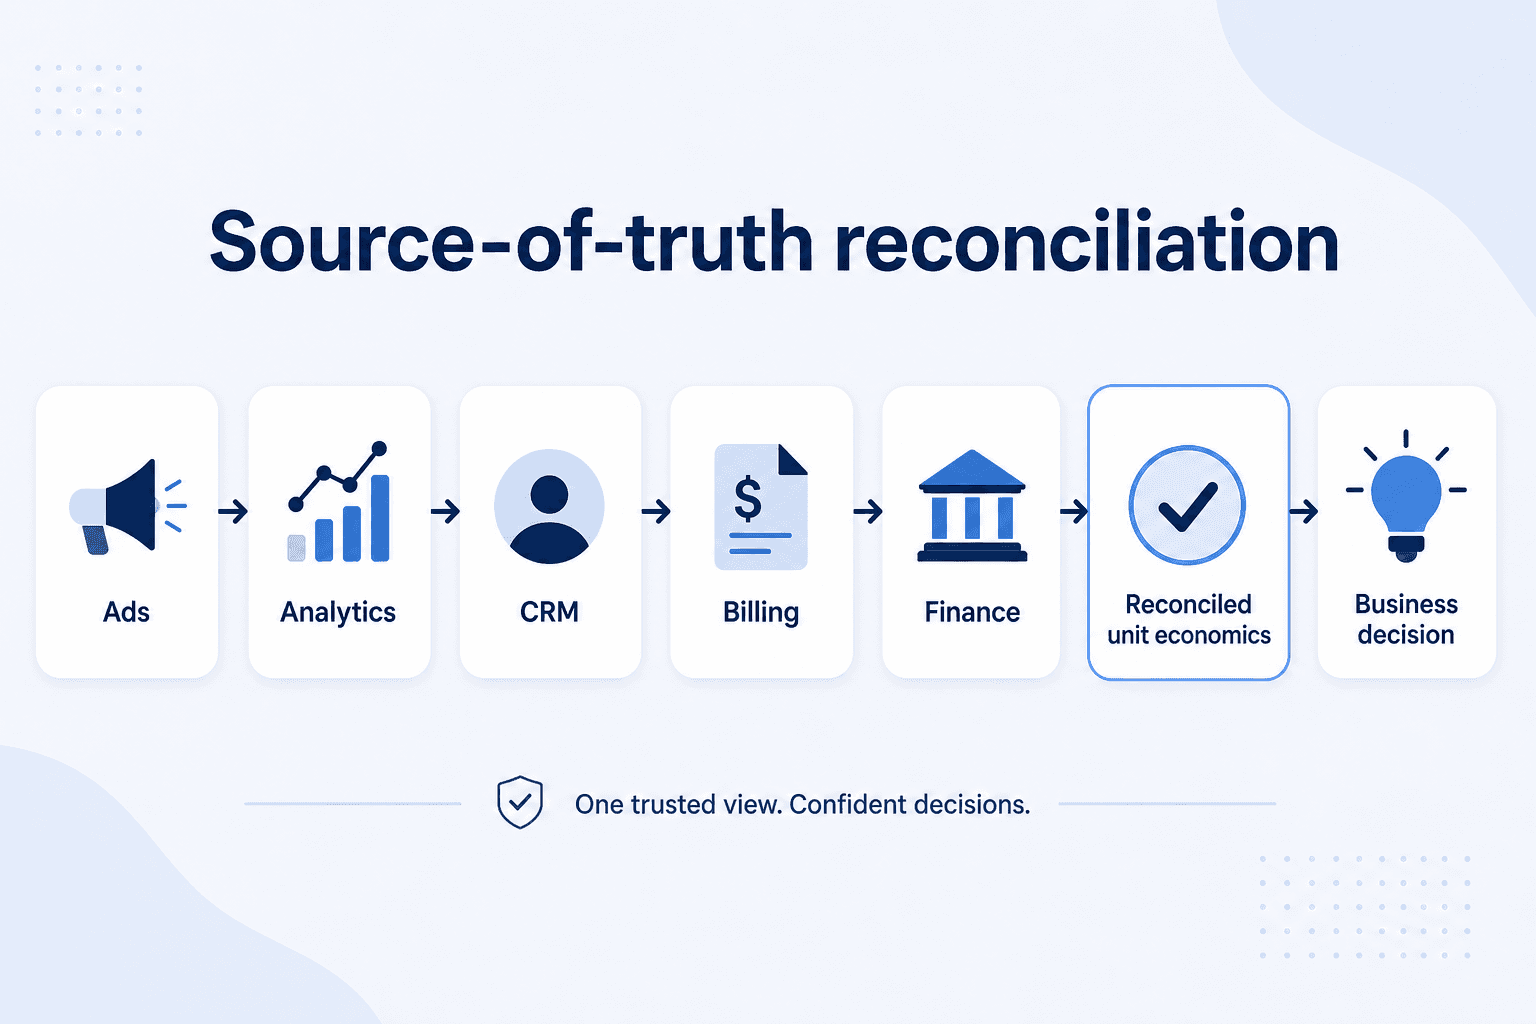
Unit economics becomes unreliable when every system answers a different part of the question using different customer identities and time periods.
A practical source-of-truth model assigns ownership:
| Input | Primary source of truth | Supporting source | Common failure |
|---|---|---|---|
| Media spend | Advertising platforms and finance | Data warehouse | Credits, taxes or agency costs handled inconsistently |
| New customer status | CRM, billing or order system | Analytics | Leads, repeat buyers or duplicate contacts counted as new |
| Acquisition source | Governed attribution layer | GA4 and ad platforms | First-touch, last-touch and platform attribution mixed |
| Revenue and refunds | Billing, ERP or payment system | CRM | Booked revenue used before refunds or cancellations |
| Gross margin and variable cost | Finance model | Operations systems | Revenue LTV treated as profit |
| Retention, repeat or repayment | Billing, product, CRM or servicing system | Analytics | Cohorts built from sessions instead of customers |
| Contribution and payback | Reconciled warehouse/model | BI layer | CAC and LTV use incompatible scopes |
Analytics is essential for customer journeys and acquisition context, but finance or billing should usually own realised revenue, refunds and collected cash. The CRM should identify qualified opportunities and customer status. The warehouse or governed model should reconcile customer identity and cohort logic.
When CAC and LTV do not match finance data, do not average the systems together. Identify which system owns each input and document the reconciliation rule.
For businesses choosing how behavioural analytics should complement warehouse and CRM data, the guide to GA4 vs Mixpanel vs Amplitude provides the wider measurement context. When server-side collection materially affects revenue or conversion accuracy, the Server-Side GTM with Cloudflare and Stape guide explains that layer in more detail.
A useful unit economics review ends with a decision, not a spreadsheet.
| Decision | Evidence pattern | Management action |
|---|---|---|
| Scale | Contribution LTV and payback fit cash constraints; cohorts are stable or improving; marginal CAC still recovers; data is reconciled | Increase spend in proven segments, monitor marginal performance and protect measurement quality |
| Improve | Economics are directionally viable, but conversion, retention, margin, pricing or measurement is the binding constraint | Fix the constraint before adding significant media budget |
| Hold | Cohorts are immature, attribution is unreliable, cash is constrained or recent trends conflict | Freeze large budget increments, collect evidence and run sensitivity scenarios |
| Stop | Marginal economics remain unprofitable after fair cost loading, or retention/margin failure is structural | Pause the source, redesign the offer or reallocate capital |
Scale when the evidence is consistent across multiple dimensions:
Improve when acquisition can work, but another constraint captures the value.
Examples:
The right growth decision may be pricing, retention, product or operations—not a lower bid.
Hold when uncertainty is too high to justify aggressive scaling.
This is not the same as doing nothing. Use the period to mature cohorts, validate attribution, reconcile finance data and test sensitivity to CAC, retention and margin changes.
Stop when the next acquisition dollar is expected to destroy contribution or when the business cannot measure the outcome well enough to govern the investment.
Stopping a channel is not a failure if it prevents weak economics from consuming cash that can be deployed elsewhere.
A practical example of how acquisition efficiency, lifetime value and payback can be connected to management decisions is available in the Mental Health Marketing Analytics case study.
The most damaging unit economics errors are usually definition and governance errors, not arithmetic errors.
Week 1: Define
Week 2: Reconcile
Week 3: Segment
Week 4: Decide
The output should be a management system: definitions, model, data ownership, decision thresholds and a repeatable review process.
An internal team can usually build the first version when:
A structured unit economics audit or specialist unit economics consulting becomes more useful when:
For self-service scenario planning, use the Predictive LTV and Payback calculator to test how changes in CAC, retention, contribution and payback affect growth decisions.
A unit economics consultant should not merely report whether growth looked efficient last quarter. They should show where value is created, how quickly cash returns, which constraint matters now and whether the next investment is likely to improve the business.
Share this article
Next step
Build one reconciled model that connects acquisition cost, customer contribution, cohort quality, cash recovery and marginal scale.
Related
A buyer's guide to SaaS unit economics consulting: scope, data, deliverables, cost drivers and the CAC, LTV and payback evidence needed before scaling.
Read article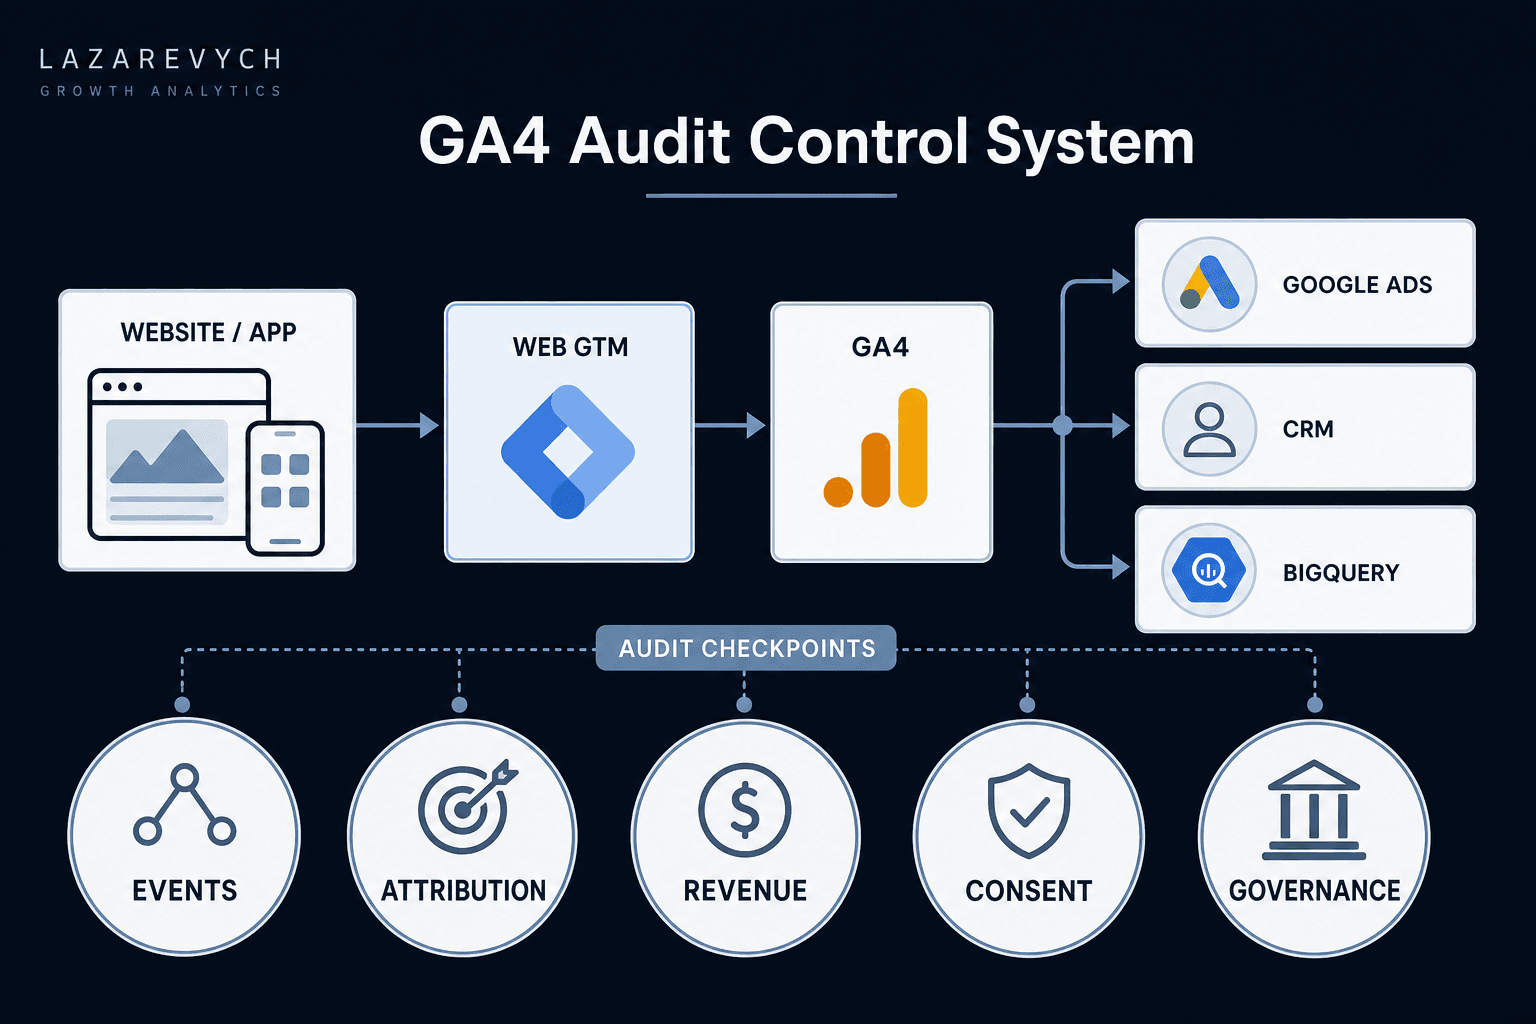
A practical GA4 audit framework for finding tracking, attribution, revenue and data-quality problems — and prioritising the issues that can damage business decisions.
Read article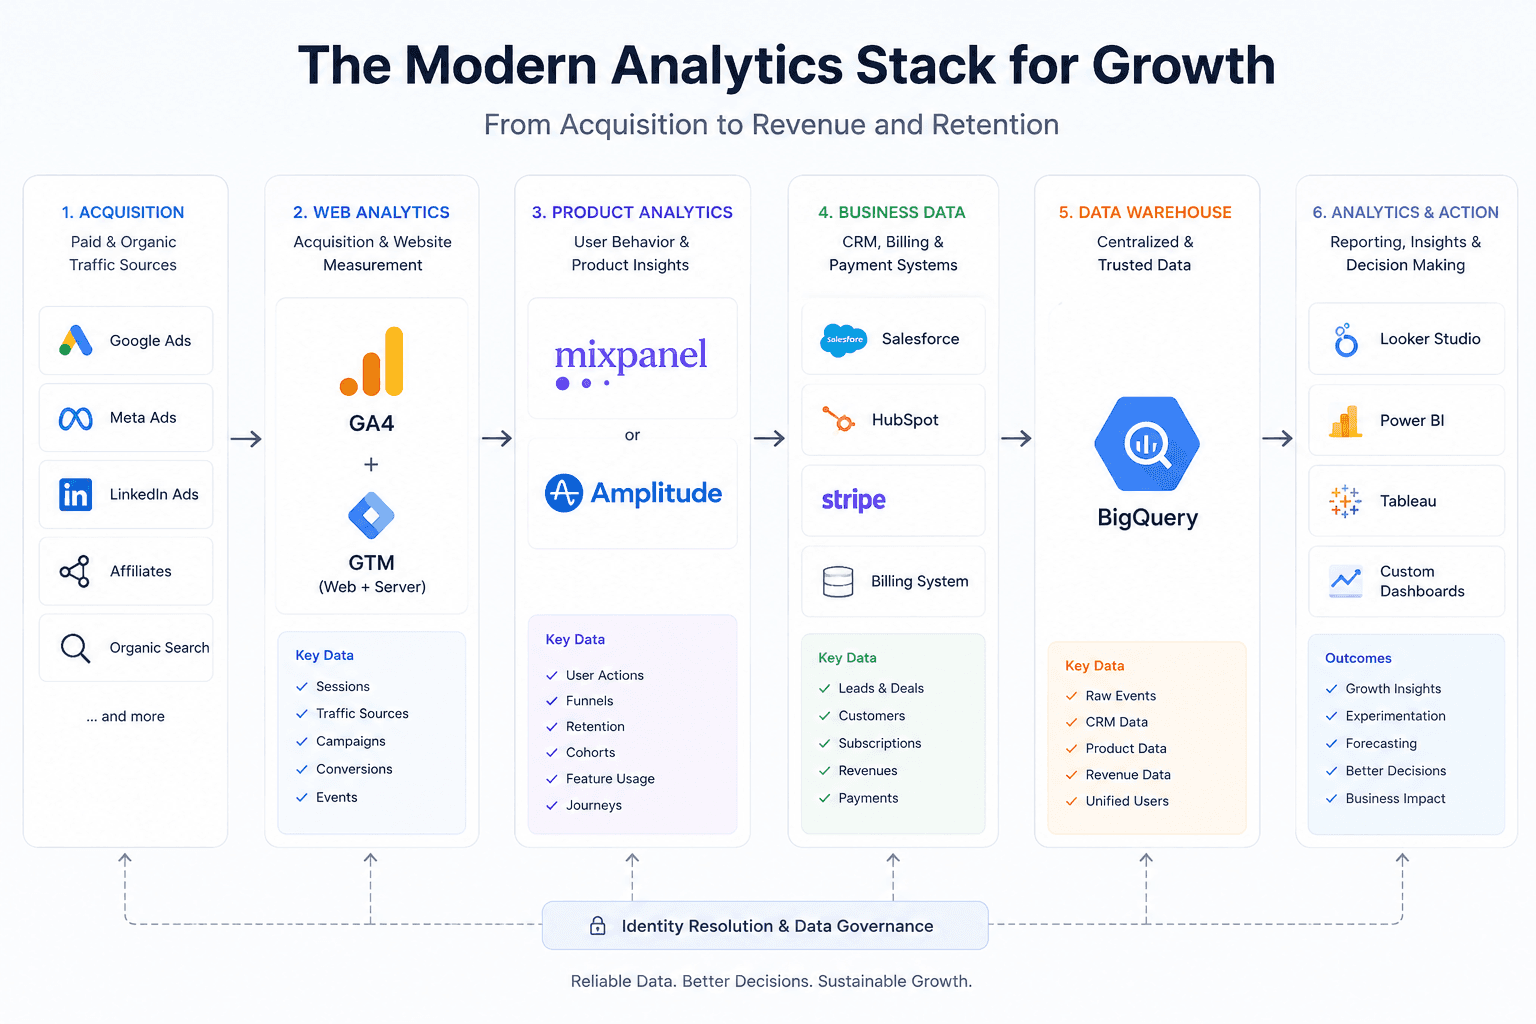
A growing business rarely suffers from a lack of data. It suffers from having data in the wrong places, answering the wrong questions. Google Analytics 4 may show which campaigns generate registrations. A CRM may show which leads become customers. A billing platform may record subscription revenue. Meanwhile, the product team may still be unable…
Read article