
Product Analytics
Product Analytics Implementation Cost for SaaS
See Mixpanel and Amplitude implementation scope, cost drivers, event tracking deliverables and buyer checks for decision-ready product analytics.
Read articleShare
This guide explains how GA4, Mixpanel and Amplitude differ, when each one becomes valuable, and how to choose an analytics stack that supports sustainable growth.
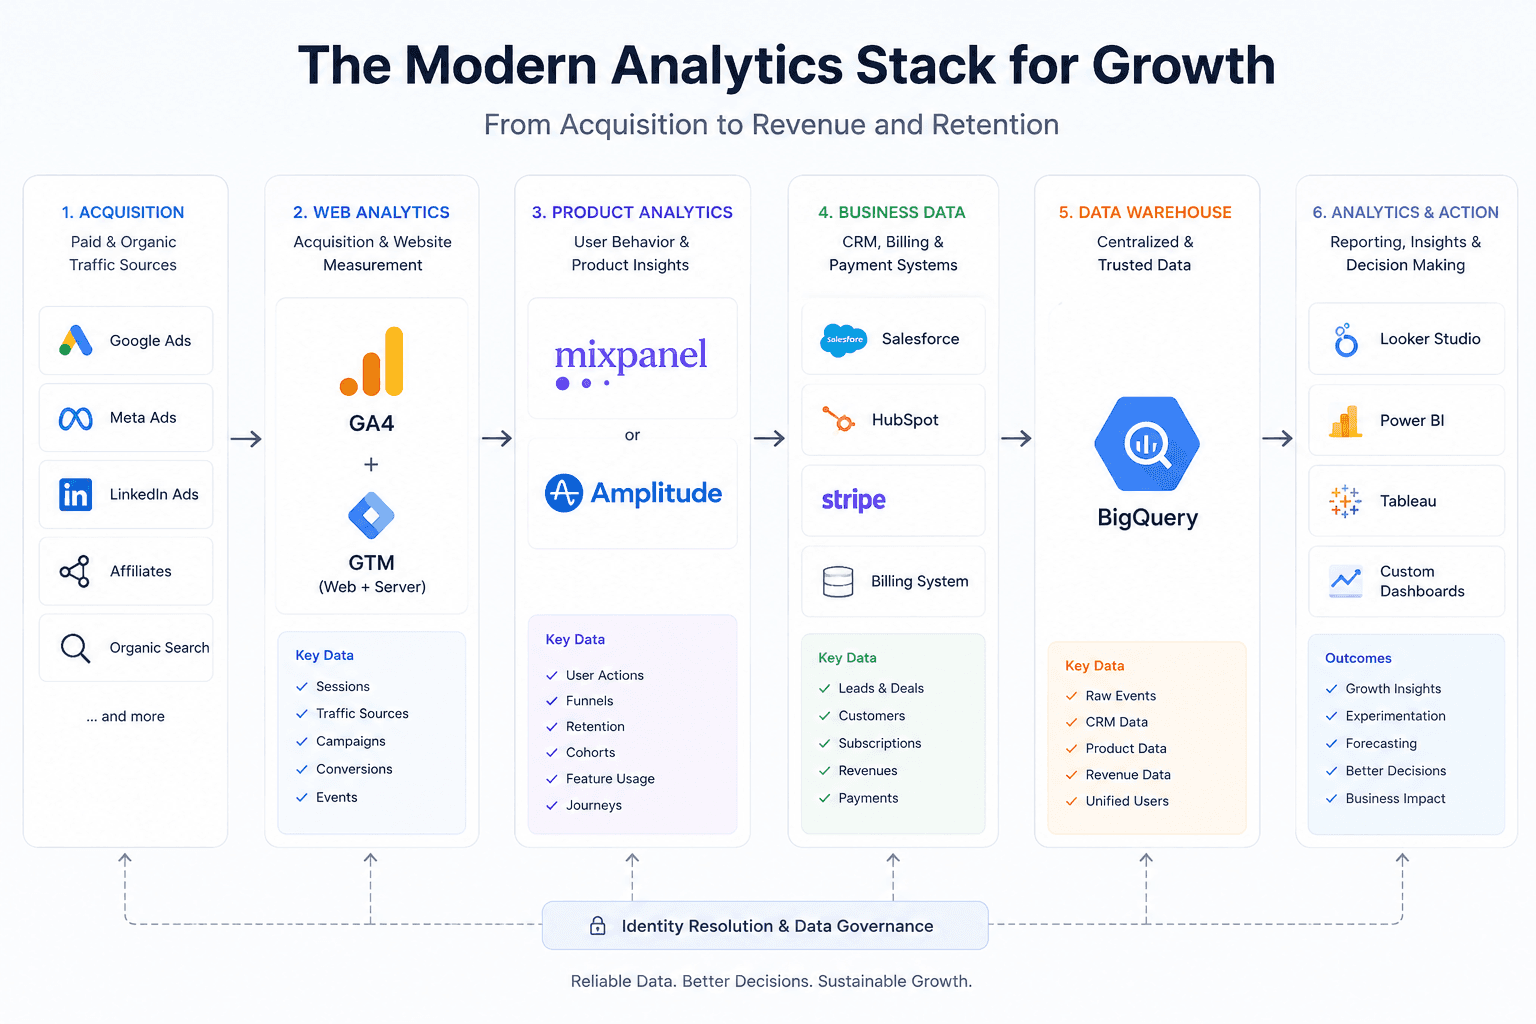
A growing business rarely suffers from a lack of data.
It suffers from having data in the wrong places, answering the wrong questions.
Google Analytics 4 may show which campaigns generate registrations. A CRM may show which leads become customers. A billing platform may record subscription revenue. Meanwhile, the product team may still be unable to explain why some users activate and others disappear, which product actions predict conversion, where onboarding creates friction, which features improve retention, which acquisition channels generate the most valuable customers, or whether a new release actually changed user behaviour.
This is where the question usually appears:
Should we use GA4, Mixpanel, or Amplitude?
The answer is not simply that one platform is better than the others. They were designed to solve different parts of the measurement problem.
GA4 is strongest at understanding acquisition and website performance. Mixpanel and Amplitude are designed for deeper behavioural and product analysis. For many growing digital businesses, the right solution is not choosing one platform—it is building a measurement system in which each platform has a clearly defined role.
This guide explains how the three platforms differ, when each one becomes valuable, and how to choose an analytics stack that supports sustainable growth.
Choosing between GA4, Mixpanel and Amplitude is only one part of the decision.
A reliable implementation may also require GTM configuration, server-side tracking, event taxonomy, identity resolution, CRM integration, BigQuery data modelling and revenue attribution.
The right setup depends on your customer journey, business model, internal resources and the decisions your teams need to make.
If your current analytics data is fragmented or cannot connect acquisition with product usage and revenue, a Growth Analytics Audit can help identify the gaps before you invest in additional tools.
The easiest way to understand the difference is to look at the questions each system is expected to answer.
Marketing analytics usually begins with acquisition:
Product analytics begins after the user arrives:
GA4 can collect event data and support custom analysis, while Mixpanel and Amplitude provide specialised workflows for funnels, retention, behavioural cohorts, journeys, segmentation and user-level product analysis. Google also allows raw GA4 event data to be exported to BigQuery for more advanced querying and combination with other business data.
The distinction is therefore not that GA4 has events while product analytics has events. All three platforms can work with events. The more important distinction is: what decisions is the platform designed to support once those events have been collected?
| Area | GA4 | Mixpanel | Amplitude |
|---|---|---|---|
| Primary orientation | Marketing and web analytics | Product and behavioural analytics | Product analytics and product intelligence |
| Best starting question | Where did users come from? | What are users doing? | What behaviours drive product outcomes? |
| Traffic-source analysis | Strong | Secondary | Secondary |
| Google Ads integration | Strong | Usually imported or passed as properties | Usually imported or passed as properties |
| Landing-page reporting | Strong | Available with implementation | Available with implementation |
| Event tracking | Yes | Yes | Yes |
| Funnel analysis | Available | Core capability | Core capability |
| Retention analysis | Available but less product-centred | Core capability | Core capability |
| Behavioural cohorts | Available in more limited workflows | Strong | Strong |
| User journeys and paths | Available through explorations | Strong | Strong |
| Feature-adoption analysis | Possible, but requires more configuration | Strong | Strong |
| B2B account analysis | Requires custom modelling | Available through group-level modelling | Supports analysis at user and account level |
| Session replay | Not a native core GA4 workflow | Available | Available |
| Experiment analysis | Requires external tooling or integrations | Available within the broader product stack | Closely integrated with experimentation capabilities |
| Raw-data warehouse export | Native BigQuery export | Warehouse integrations and connectors | Warehouse and warehouse-native options |
| Ideal audience | Marketing and acquisition teams | Startups and product-led growth teams | Product organisations needing deeper product analysis |
| Typical role in the stack | Acquisition measurement | Fast self-serve behavioural analysis | Product intelligence, experimentation and governance |
Amplitude documents funnels, retention, journeys, behavioural cohorts, dashboards and account-level analysis among its product analytics capabilities. Mixpanel provides funnels, retention, cohorts and session replay, and also supports connecting warehouse data for analysis.
This table should not be interpreted as a permanent feature checklist. Product capabilities and commercial plans evolve. The more durable comparison is based on each platform's analytical orientation and the workflows it makes easiest for teams.
GA4 remains an important part of the analytics stack for most websites and digital products. Its main value is the connection between user acquisition, website behaviour and Google's advertising ecosystem.
GA4 helps marketing teams understand source and medium, campaign performance, organic, direct, referral and paid traffic, landing-page engagement, website and app conversions, and cross-channel acquisition patterns.
This makes it particularly useful for answering which campaigns generate registrations, which landing page converts visitors most efficiently, how paid search compares with organic traffic, and which markets or devices produce the highest conversion rate.
For businesses investing heavily in Google Ads, GA4 also provides a natural measurement layer between advertising activity and website outcomes.
GA4 can support page and screen tracking, lead-generation events, ecommerce events, purchases and revenue, custom conversions, audiences, and website and app measurement. This is often sufficient for corporate websites, content websites, service businesses, smaller ecommerce businesses and lead-generation funnels with a relatively short journey.
GA4 and BigQuery integration is one of the most valuable components of a scalable analytics implementation.
Google allows raw event data from Analytics properties to be exported to BigQuery. This makes it possible to query event-level data using SQL and combine it with external datasets. Google also notes that BigQuery export data may differ from the GA4 interface because the interface applies additional processing and reporting logic.
With the right data architecture, GA4 data can be combined with advertising spend, CRM contacts and deals, subscription payments, customer-support data, product usage, refunds, loan performance, gross margin and customer lifetime value.
However, enabling the native export is only the first step. A production-ready BigQuery implementation also requires data models, customer identifiers, attribution logic, CRM joins, metric definitions and reporting layers. This means GA4 should not be dismissed as a simple traffic-reporting platform. Its raw-data export can become an important input to a broader analytical system.
The limitations of GA4 usually appear when a business stops asking only acquisition questions.
Consider a SaaS company with a journey from Google Ads visit, account creation, onboarding, connecting a data source, creating a first project, inviting a teammate, returning several times, upgrading after 30 days, expanding three months later, and eventually renewing or churning.
GA4 can collect events across this journey. But collecting events is not the same as creating an analysis system that allows product managers, founders and growth teams to investigate the journey quickly.
As the product becomes more complex, the business needs reusable behavioural cohorts, flexible funnels, retention curves, account-level analysis and user-level investigation. That is the core territory of product analytics.
Mixpanel is designed to help teams analyse what users do inside a digital product.
A successful Mixpanel implementation requires more than installing the SDK. The company needs a measurement strategy, event taxonomy, user and account identity model, required event properties, governance rules and validated tracking. Its core value is fast, self-service behavioural analysis.
Learn more about product analytics implementation and how behavioural data can be connected with acquisition, CRM and revenue outcomes.
Mixpanel's retention reports are designed to measure engagement over time, while its cohort functionality allows teams to visually define user groups and reuse them across analyses. Session Replay can be used to examine the actual sessions behind behavioural patterns.
Mixpanel is often a strong choice for early-stage and growth-stage SaaS, mobile applications, marketplaces, EdTech platforms, subscription products, product-led growth companies and teams introducing product analytics for the first time.
Its practical advantage is often speed. A properly implemented Mixpanel project allows growth and product teams to move from a question to a segmented funnel or retention report without waiting for a data analyst to write a new query for every investigation.
A product manager could analyse: among users who registered in the last 30 days, how many connected a data source within 24 hours?
A growth manager could compare: do users acquired through Google Search retain better than users acquired through Meta?
A founder could investigate: which early behaviours are most common among customers who upgrade to a paid plan?
A customer-success team could create a cohort of paying accounts that have not completed a key product action during the last 14 days, then use it for lifecycle communication, sales outreach or churn-prevention workflows.
Amplitude solves many of the same core problems as Mixpanel: funnels, retention, segmentation, behavioural cohorts, journeys, dashboards, product usage and account-level analysis.
Amplitude's documentation describes a broad set of chart types for investigating funnels, retention and journeys, as well as the ability to reuse cohorts across analysis and experimentation workflows. It also supports rolling usage and revenue up to a company, workspace or account level for B2B analysis.
Amplitude implementation is most valuable when the platform is connected to a governed tracking plan, account-level identity, experimentation workflows and trusted revenue or warehouse data.
The platform is often attractive to more mature product organisations because product analytics can be connected with experimentation, feature management, behavioural cohorts, product planning, data governance, account-level reporting and warehouse-based data models.
Amplitude may be particularly suitable for larger product organisations, companies with dedicated product and experimentation teams, B2B SaaS platforms requiring account-level analysis, businesses with multiple products or complex user journeys, organisations that want product analytics and experimentation more tightly connected, and teams that require more formal metric definitions and governance.
Amplitude also offers warehouse-native analysis, allowing teams to build analyses from models based directly on warehouse data rather than necessarily ingesting all event and user data into a separate analytical store.
A product team could ask: which behaviours during the first seven days are associated with D90 retention?
An experimentation team could investigate: did the redesigned onboarding experience improve activation without reducing later retention?
A B2B SaaS company could analyse: which workspaces have declining usage across multiple users and may be at risk of churn?
A growth team could compare: which acquisition cohorts produce the highest rate of activated and retained accounts, not just individual registrations?
The overlap between Mixpanel and Amplitude is substantial. Both can support sophisticated product analytics when implemented correctly.
The most important decision is therefore not based on a single feature. It should be based on organisational requirements.
| Decision factor | Mixpanel may be the better fit when… | Amplitude may be the better fit when… |
|---|---|---|
| Time to first value | The team wants to begin building funnels and cohorts quickly | The company is prepared to build a broader product-intelligence system |
| Team maturity | Product analytics is relatively new | Dedicated product, data and experimentation teams already exist |
| Primary users | Growth, product and marketing teams need accessible self-service analysis | Multiple product teams require governed, reusable analytical workflows |
| Complexity | The product journey is important but relatively understandable | The product has multiple journeys, products, account types or advanced segmentation needs |
| Experimentation | Analytics may initially be separate from the testing stack | Analytics, cohorts and experimentation should work closely together |
| B2B analysis | User behaviour is the main unit of analysis | Account, workspace and organisation-level behaviour is especially important |
| Warehouse strategy | The team wants to enrich behavioural analysis with warehouse data | Warehouse-native or deeply warehouse-connected analysis is a strategic requirement |
| Operational preference | Simplicity and fast adoption are priorities | Governance, scale and product-operating maturity are priorities |
The platform decision should therefore be made together with the implementation plan. Event design, identity resolution, data governance, CRM integration and warehouse architecture may have a greater impact on analytics quality than the final vendor choice.
Need help selecting and implementing the right product analytics platform? Request a Growth Analytics Audit.
This does not mean Mixpanel is only for small companies or Amplitude is only for enterprises. It means the choice should reflect who will use the platform, which decisions they need to make, how mature the product organisation is, how analytics will connect with experimentation, whether the primary entity is a user, account, subscription or organisation, and where the source of truth will live.
In many companies, implementation quality will matter far more than the difference between the two vendors.
Imagine two acquisition campaigns. Both campaigns generate 500 registrations at a CPA of $20. From a top-of-funnel perspective, they appear identical.
| Metric | Campaign A | Campaign B |
|---|---|---|
| Advertising spend | $10,000 | $10,000 |
| Registrations | 500 | 500 |
| Cost per registration | $20 | $20 |
| Registration conversion rate | 8% | 8% |
A marketing report could conclude that both campaigns perform equally well. But product analytics reveals what happens after registration.
| Metric | Campaign A | Campaign B |
|---|---|---|
| Registrations | 500 | 500 |
| Onboarding completed | 360 | 195 |
| Activation rate | 48% | 14% |
| Paid customers | 105 | 30 |
| Registration-to-paid rate | 21% | 6% |
| D90 retained users | 190 | 40 |
| D90 retention rate | 38% | 8% |
| Revenue after 90 days | $31,500 | $7,500 |
| Revenue per registration | $63 | $15 |
| CAC per paid customer | $95 | $333 |
Illustrative data used to demonstrate the analytical difference.
The initial CPA was identical. The cost per acquired customer was not. The retained-user volume was not. The revenue generated by each registration was not. The campaign with the same registration CPA ultimately produced more than four times the 90-day revenue in this illustrative scenario.
GA4 is valuable for understanding how the campaigns acquired users. Mixpanel or Amplitude is valuable for explaining what those users did after acquisition. CRM and billing data are needed to determine what they eventually purchased and how much revenue they generated. The complete decision cannot be made from any one of these systems in isolation.
Many businesses optimise campaigns around the first measurable conversion: registration, lead, app install, account creation, trial start or loan application.
These are important events, but they are not always reliable indicators of economic value. A campaign can generate a low cost per registration while attracting users who never complete onboarding, never reach activation, never return, consume bonuses but do not become profitable, request refunds, default on a loan, churn before recovering acquisition cost, generate high support costs, or remain free users indefinitely.
The better acquisition question is not which channel generates the cheapest conversion. It is which channel generates the highest amount of retained, risk-adjusted or gross-margin-adjusted customer value relative to acquisition cost. That requires connecting acquisition data with product behaviour and financial outcomes.
GA4 may tell you that Campaign X generated 1,000 registrations, Campaign Y generated 800, Campaign X had the lower cost per registration, and Landing Page A converted better than Landing Page B.
It may not provide the easiest operational workflow for determining which users reached activation, which features they adopted, how retention differed by cohort, whether account-level usage expanded, what behavioural sequence predicted conversion, or how much gross margin those customers eventually generated.
Mixpanel or Amplitude may tell you which users activated, where the funnel dropped, which behaviours correlated with retention, which cohorts used a feature, and what users did before upgrading or churning.
But product analytics alone may not contain reliable answers about advertising cost, complete attribution, sales-qualified pipeline, offline sales, refunds, credit losses, gross margin, recognised revenue or customer-support costs.
A CRM may show lead status, deal stage, sales owner, closed revenue, lost reason and sales-cycle duration. But it normally does not explain what users did inside the product, which feature increased conversion, where onboarding failed, or how engagement changed before churn.
A data warehouse can theoretically answer almost any properly modelled question. But warehouse data alone does not automatically provide a convenient self-service environment for every product manager or growth specialist. Without a semantic layer, governed metrics and accessible analytical interfaces, the data team may become a permanent queue for routine questions.
That is why the strongest analytics architecture usually combines these layers instead of forcing one tool to perform every role.
A scalable measurement system may look like this:
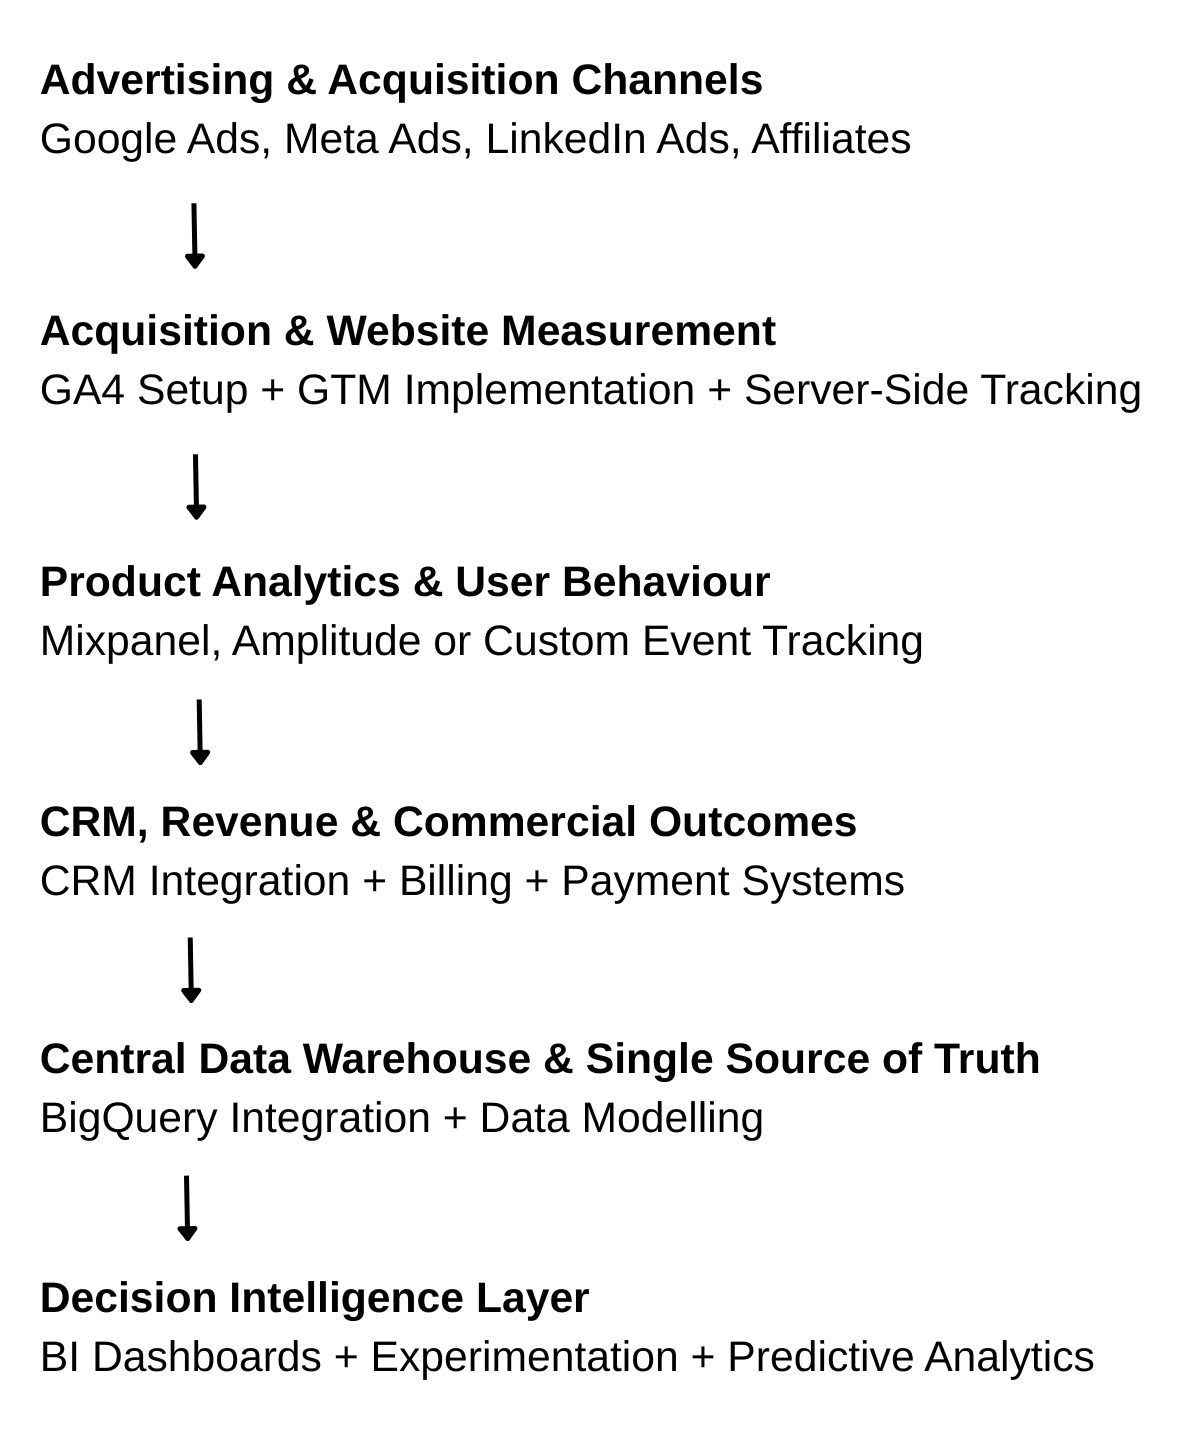
Each layer has a different responsibility.
| Layer | Primary purpose | Example questions |
|---|---|---|
| Advertising platforms | Media delivery and optimisation | Which campaign should receive more budget? |
| GA4 | Acquisition and website measurement | Which sources and landing pages generate conversions? |
| Mixpanel or Amplitude | Product behaviour | Which actions drive activation, conversion and retention? |
| CRM | Sales and customer lifecycle | Which leads became opportunities and customers? |
| Billing or core database | Financial truth | How much revenue, margin or loss did each customer generate? |
| Data warehouse | Data unification | What is the complete customer journey across systems? |
| BI | Operational and executive reporting | Are CAC, LTV, payback and retention improving? |
| Experimentation platform | Causal validation | Did the change actually create incremental improvement? |
| Predictive models | Forward-looking decisions | Which users are likely to convert, churn or repay? |
Depending on the current maturity of the business, implementation may begin with GA4 and GTM setup, CRM integration, product analytics implementation, or BigQuery implementation as a source of truth. Growth Engineering covers the technical implementation layer when the architecture is ready to ship.
This architecture prevents a common mistake: allowing each department to define a different version of the customer. Marketing sees a browser. Product sees a user ID. Sales sees a CRM contact. Finance sees a customer or invoice. The warehouse should connect these identities into a governed model.
Installing an SDK is not the same as implementing analytics. One of the hardest parts is identity resolution.
Before registration, a person may be represented by an anonymous device ID, browser cookie, session ID, advertising click ID or first-party visitor ID. After registration, the same person may receive a user ID, account ID, workspace ID, CRM contact ID, subscription ID, customer ID or organisation ID.
If these identifiers are not connected correctly, the business may split one customer into several users, attribute post-registration activity incorrectly, double-count users, lose the original acquisition source, combine unrelated users, calculate inaccurate funnels, build misleading retention cohorts, or fail to connect product usage with revenue.
A serious implementation should define how anonymous users are identified, when identity is assigned, how anonymous history is merged, which ID represents the user and account, how the user connects with CRM and billing, how cross-device behaviour is handled, which system owns each identifier, what happens when users log out, switch accounts or share devices, and how consent and deletion requests are respected.
The tool matters. The identity model matters more. Identity-resolution design should therefore be completed before GA4, Mixpanel, Amplitude, CRM and BigQuery data are used as a single customer-level measurement system.
Another common failure is collecting hundreds of events without a clear decision framework. A tracking plan should not begin with what can we track. It should begin with which business decisions must the data support.
A professional analytics implementation should produce a documented tracking plan before developers begin sending events to GA4, Mixpanel or Amplitude.
Each event should have a clear business definition, an owner, a trigger specification, required properties, expected data type, allowed values, implementation method, testing criteria, privacy classification and downstream use cases. Without this governance, GA4, Mixpanel and Amplitude can all become expensive containers of unreliable data.
Consider this question: which acquisition channel produces the best customers? Each system contributes a different part of the answer.
| System | Contribution |
|---|---|
| Advertising platform | Spend, impressions, clicks and campaign structure |
| GA4 | Sessions, landing pages, acquisition source and initial conversions |
| Mixpanel or Amplitude | Activation, product usage, retention and feature adoption |
| CRM | Lead qualification, opportunity creation and sales outcome |
| Billing system | Payments, refunds, subscription changes and revenue |
| Warehouse | Unified customer-level dataset |
| BI or modelling layer | CAC, LTV, payback, margin and cohort forecast |
The complete evaluation may include cost per registration, cost per activated user, cost per retained user, cost per paid customer, D30, D90 and D180 retention, revenue per acquired user, gross margin per customer, refund or default rate, repeat purchase or renewal rate, cumulative LTV, payback period, LTV/CAC and marginal LTV/marginal CAC. This is how analytics moves from campaign reporting to growth decision-making.
Your business may only need GA4 when the website mainly generates leads, the customer journey on the site is short, there is no logged-in product, product retention is not relevant, the main questions concern traffic and lead generation, and CRM data covers the rest of the sales process.
GTM → GA4 → CRM → optional BigQuery or BI
For this type of business, GA4 setup should be designed together with CRM integration. Otherwise, marketing optimisation stops at the form submission instead of measuring qualified leads, opportunities and closed revenue. The priority should be reliable conversion tracking, UTM and click-ID preservation, CRM source mapping, offline conversion import, lead-quality reporting, and qualified-pipeline and revenue measurement. Adding a product analytics platform without a real product journey may create unnecessary complexity.
Product analytics becomes valuable when users create accounts, onboarding has multiple steps, there is a meaningful activation event, users interact with the product repeatedly, retention matters, the team releases new features, and trial-to-paid conversion needs improvement.
GA4 + Mixpanel or Amplitude + CRM/billing
A SaaS product analytics implementation should define activation, user identity, account identity, onboarding stages, monetisation events and retention logic before selecting dashboards. Key analyses usually include registration-to-activation funnel, time to activation, onboarding drop-off, trial-to-paid conversion, D7 and D30 retention, feature adoption, acquisition quality by channel and early churn indicators.
Mixpanel may be particularly attractive when fast adoption and accessible self-service analysis are priorities. Amplitude may be attractive when the company expects experimentation and product analytics to become a central operating system.
A B2B product often needs both user-level and account-level measurement. One company may contain several users, different roles, one shared subscription, multiple workspaces, different levels of feature access, and one contract and renewal date. Looking only at individual users may create the wrong interpretation.
GA4 + Mixpanel or Amplitude + CRM + billing + BigQuery + BI
For growing B2B SaaS companies, BigQuery implementation becomes valuable when user-level product activity must be connected with account-level CRM, billing, expansion and renewal data. The business should model user and account activation, active users per account, breadth of feature adoption, depth of usage, seat utilisation, champion activity, account health, expansion signals, and renewal and churn risk.
Amplitude explicitly supports rolling usage and revenue up to company, team or workspace level, which can be useful for B2B product analysis.
FinTech analytics must connect acquisition quality with financial risk. A cheap lead or approved application is not necessarily a profitable customer.
GA4 + product analytics + CRM or loan-management system + risk data + payment data + warehouse + BI/risk models
Relevant metrics may include application completion, approval rate, issue rate, KYC completion, first payment default, delinquency, probability of default, loss given default, recovery rate, repeat borrowing, risk-adjusted LTV and risk-adjusted payback. Product analytics can explain funnel behaviour. It cannot replace the risk and financial systems that determine whether the issued loan generated economic value.
A smaller ecommerce store may work effectively with GA4 + ecommerce platform + advertising platforms.
A more mature ecommerce business may add product analytics when it needs to understand repeat customer behaviour, loyalty and subscription journeys, cross-category adoption, time between purchases, customer cohorts, app engagement, personalised product usage and lifecycle behaviour beyond a single purchase.
The decision depends on whether the business needs only transaction reporting or deeper longitudinal customer analysis.
Before purchasing or implementing GA4, Mixpanel, Amplitude or a data warehouse, the company should define the decisions, entities, users and source-of-truth requirements the system must support. Use the following questions before selecting a platform.
Choose GA4 first when the primary question is how users are acquired. Choose product analytics when the primary question is what users do after acquisition. Use a warehouse when the primary question is how acquisition, product behaviour, CRM outcomes and financial value connect.
The tool and data model should reflect the actual unit of business value.
Marketing, product managers, growth, data analysts, engineers, sales, customer success, finance and executive leadership may all need answers. A platform that only analysts can use may not create sufficient adoption. A platform that is easy to use but built on unreliable definitions may create confident but incorrect decisions.
Product analytics becomes more valuable as the journey gains more steps, longer conversion windows, repeated product usage, multiple users per account, recurring revenue, expansion and contraction, multiple devices, and several products or workspaces.
For an early-stage business, the analytics platform may temporarily act as the main behavioural reporting layer. For a mature business, the source of truth will usually move toward a central warehouse with governed models. The product analytics platform then becomes a powerful self-service interface over trusted behavioural or warehouse data.
If you are unsure where your organisation sits, run the Growth Assessment or browse the Growth Tools hub for related diagnostics.
| Business stage | Recommended setup | Primary goal |
|---|---|---|
| Marketing website | GTM + GA4 + CRM | Reliable acquisition and lead tracking |
| Early digital product | GA4 + Mixpanel or Amplitude | Understand onboarding and activation |
| Growing SaaS | GA4 + product analytics + CRM + billing | Connect acquisition, usage and revenue |
| Scaling B2B SaaS | Full stack + BigQuery + account model | Measure account health, expansion and payback |
| Mature product organisation | Warehouse-centred stack + experimentation | Govern metrics and validate causal impact |
| Predictive stage | Unified warehouse + ML/AI models | Forecast LTV, churn, risk and resource allocation |
Not sure which stage best describes your current setup? A Growth Analytics Audit can assess your existing tracking, CRM, product analytics and warehouse maturity.
A successful analytics implementation should not be measured by the number of tracked events. It should be measured by the business decisions it improves.
Professional analytics implementation services should deliver a decision-ready measurement system—not merely a list of configured tags and dashboards. A strong implementation should allow the company to answer:
If the stack cannot answer these questions, adding more dashboards will not solve the underlying problem.
GA4 is an important measurement system, but it should not be expected to replace CRM, billing, internal product databases, risk systems, finance data or warehouse modelling.
A product analytics SDK does not automatically create product insight. Without defined activation, retention, monetisation and lifecycle logic, the platform will only display disconnected events.
Events such as button_clicked may be technically correct but strategically weak. The tracking plan should prioritise business-relevant actions such as onboarding_completed, first_value_reached, project_created, integration_connected, subscription_started and renewal_completed.
The same event may have very different meaning depending on plan, role, acquisition source, account type, product category, country, device, experiment variant or lifecycle stage. Properties are essential for useful segmentation.
Marketing, product and finance may calculate “customer,” “revenue,” “conversion” and “retention” differently. A measurement plan should define each metric centrally.
A behaviour associated with retention is not automatically causing retention. Power users may use a particular feature because they are already more motivated. Causal decisions should be validated with randomised experiments, holdout groups, phased rollouts, geo experiments or credible quasi-experimental designs.
Product analytics identifies patterns and hypotheses. Experimentation validates whether acting on those patterns changes outcomes.
Scaling acquisition before connecting campaigns to activation, retention and revenue can increase spend while reducing customer quality. The tracking foundation should be validated before aggressive scaling.
These issues are difficult to identify from dashboards alone. An analytics audit should validate event quality, identities, attribution, CRM mapping, metric definitions and business use cases.
The most important conclusion is that GA4, Mixpanel and Amplitude should not be evaluated only as competing dashboards. They should be evaluated as components of a decision system.
GA4 explains how users arrive. Mixpanel or Amplitude explains what users do. CRM and billing systems explain what customers buy. The warehouse connects those behaviours to long-term business value. That combination allows a growing company to stop optimising for surface-level conversions and start optimising for activation, retention, revenue and sustainable growth.
The value of analytics does not come from having more tools. It comes from connecting customer behaviour to business outcomes.
A technically correct implementation can still fail if identities are fragmented, events do not reflect the customer journey, product and marketing taxonomies conflict, CRM revenue is disconnected, metrics have no owners, or dashboards do not lead to decisions.
A strong analytics system should help the business decide where to invest acquisition budget, which onboarding friction to remove, which product features to improve, which segments to prioritise, which customers are likely to churn, and whether growth is creating long-term value.
That is the difference between installing analytics and building data-driven growth infrastructure.
I help growing SaaS, FinTech and digital businesses design and implement analytics systems that connect marketing acquisition, product behaviour, CRM outcomes, revenue, retention and customer lifetime value. The engagement can begin with a Growth Analytics Audit and continue into implementation across GA4, GTM, server-side tracking, Mixpanel or Amplitude, CRM, BigQuery, BI and experimentation.
Share this article
Next step
Not sure whether you need GA4, Mixpanel, Amplitude—or a combination connected through CRM and BigQuery? Review the stack before adding another dashboard.
Related
See Mixpanel and Amplitude implementation scope, cost drivers, event tracking deliverables and buyer checks for decision-ready product analytics.
Read article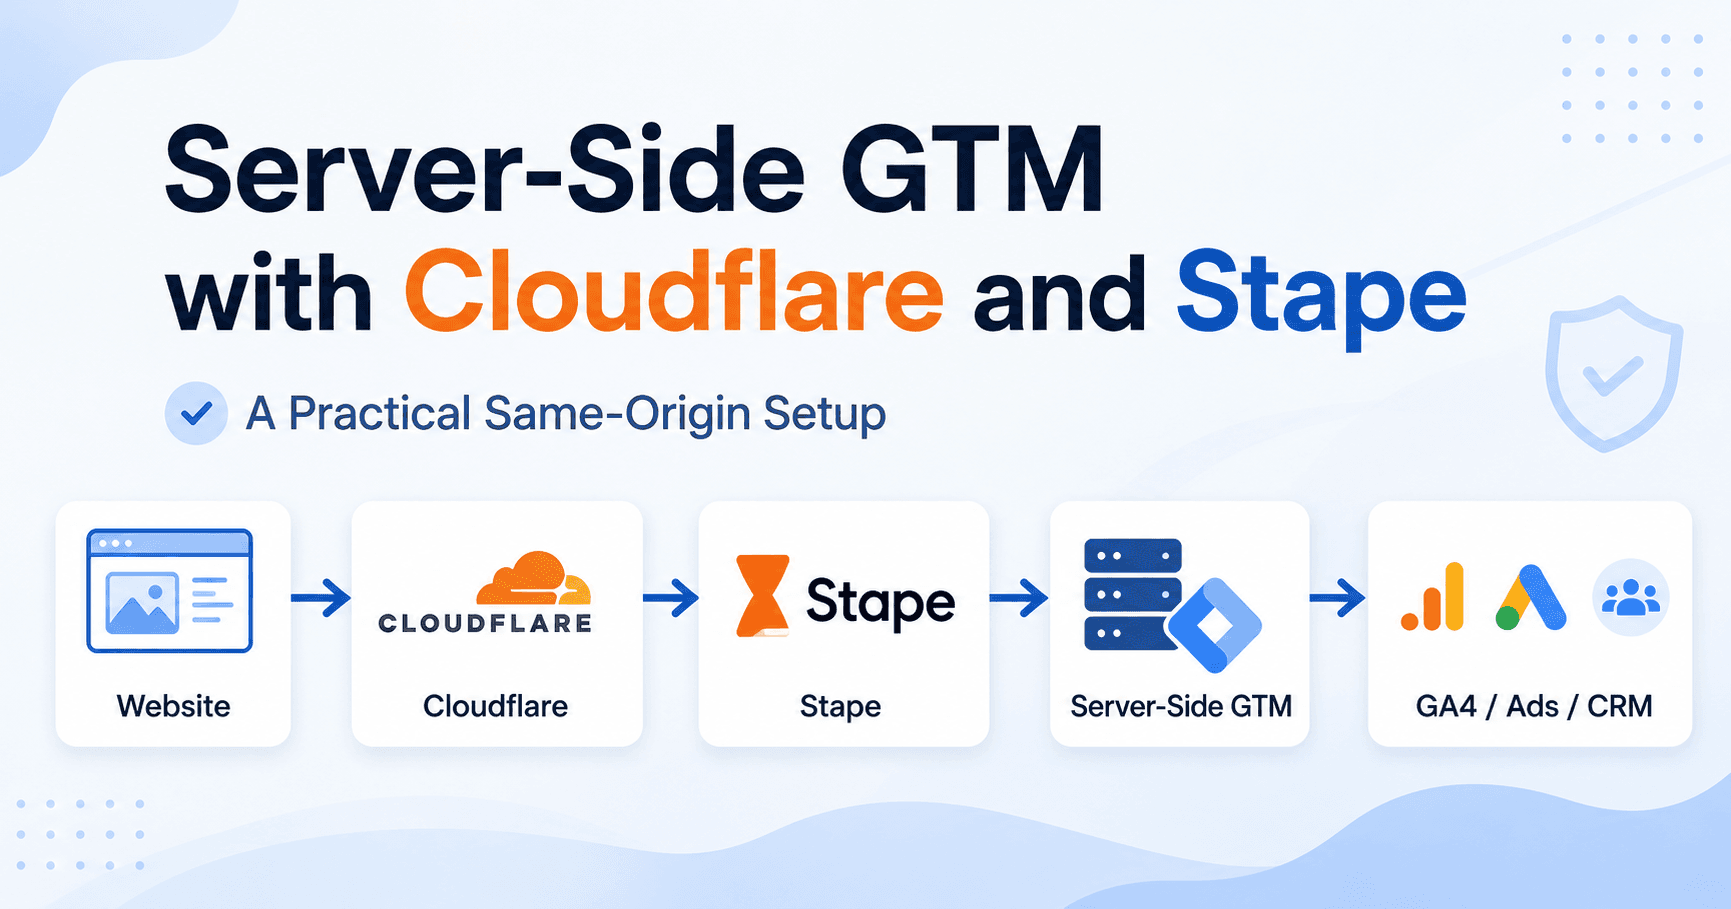
Most businesses do not have a tracking problem because they lack data. They have a tracking problem because their data is fragmented, duplicated, blocked, delayed or disconnected from the systems where revenue is actually recorded. Google Analytics may show one number. Advertising platforms may show another. CRM data may not match either of them. Conversions…
Read article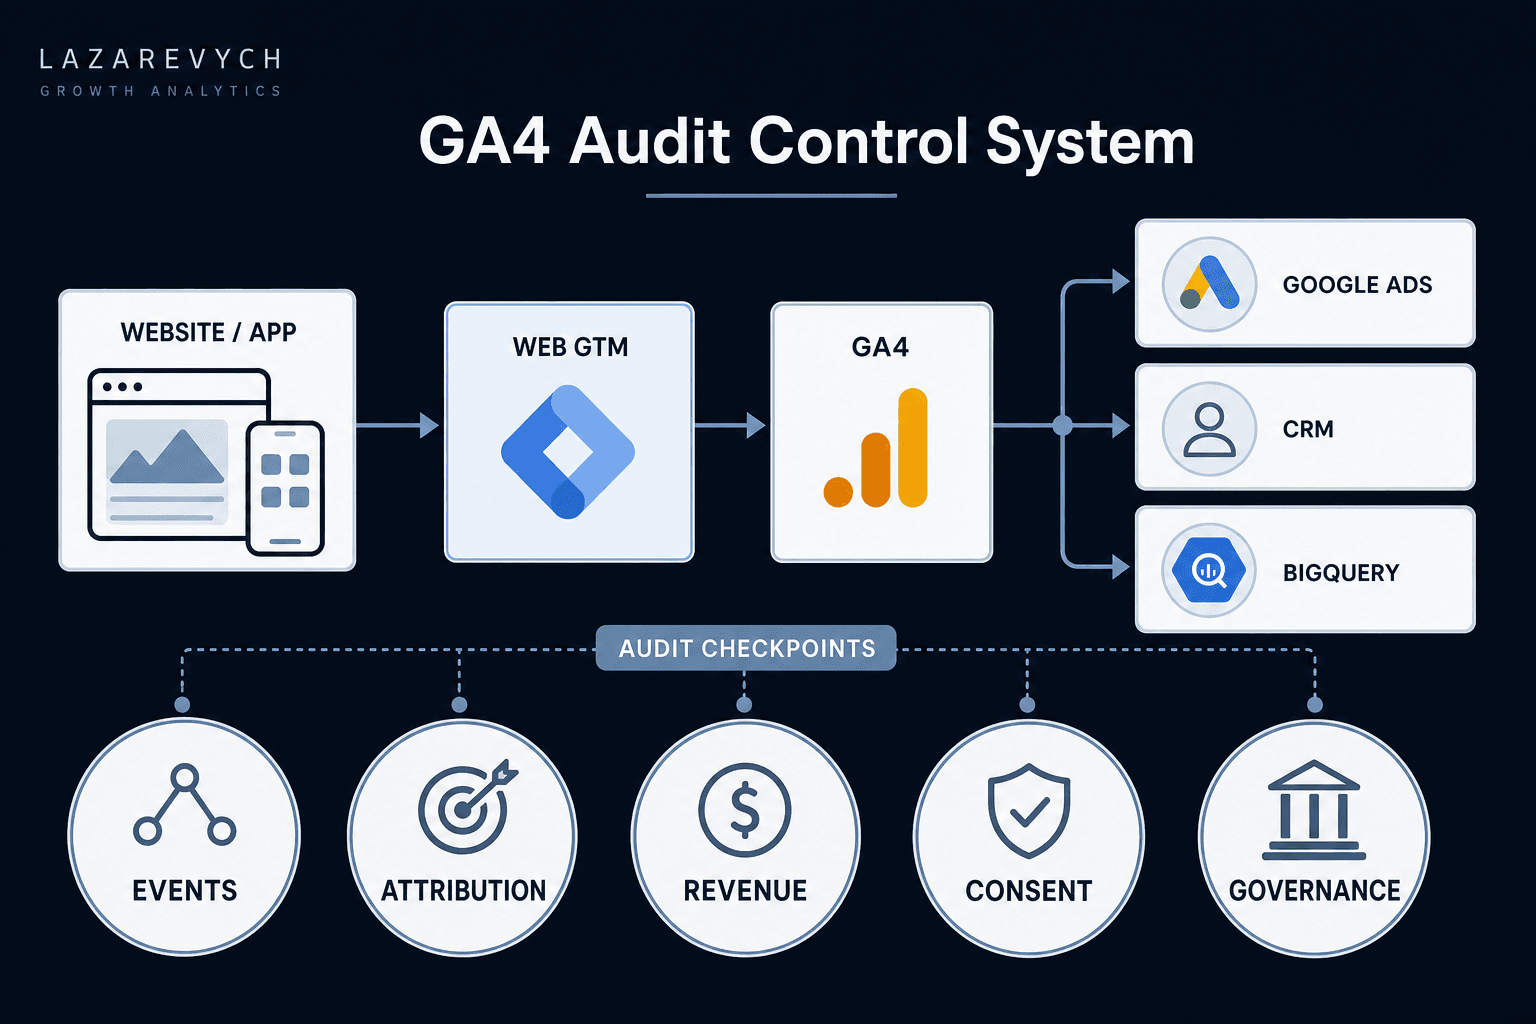
A practical GA4 audit framework for finding tracking, attribution, revenue and data-quality problems — and prioritising the issues that can damage business decisions.
Read article