How to Interpret A/B Test Results: Statistical Significance, Confidence Intervals and Practical Significance
A business-first guide to deciding whether an A/B test result is trustworthy, meaningful and strong enough to change what you do next.
An A/B test does not become useful the moment one variant has a higher conversion rate. A trustworthy interpretation requires several layers: the experiment must be valid, the observed effect must be large enough to matter, the uncertainty around that effect must be understood, and the result must be strong enough to support a business decision.
The practical question is not simply “Did variant B win?” It is:
Is the observed result credible, how large might the true effect be, and would that effect justify changing the product, funnel or acquisition strategy?
The short answer
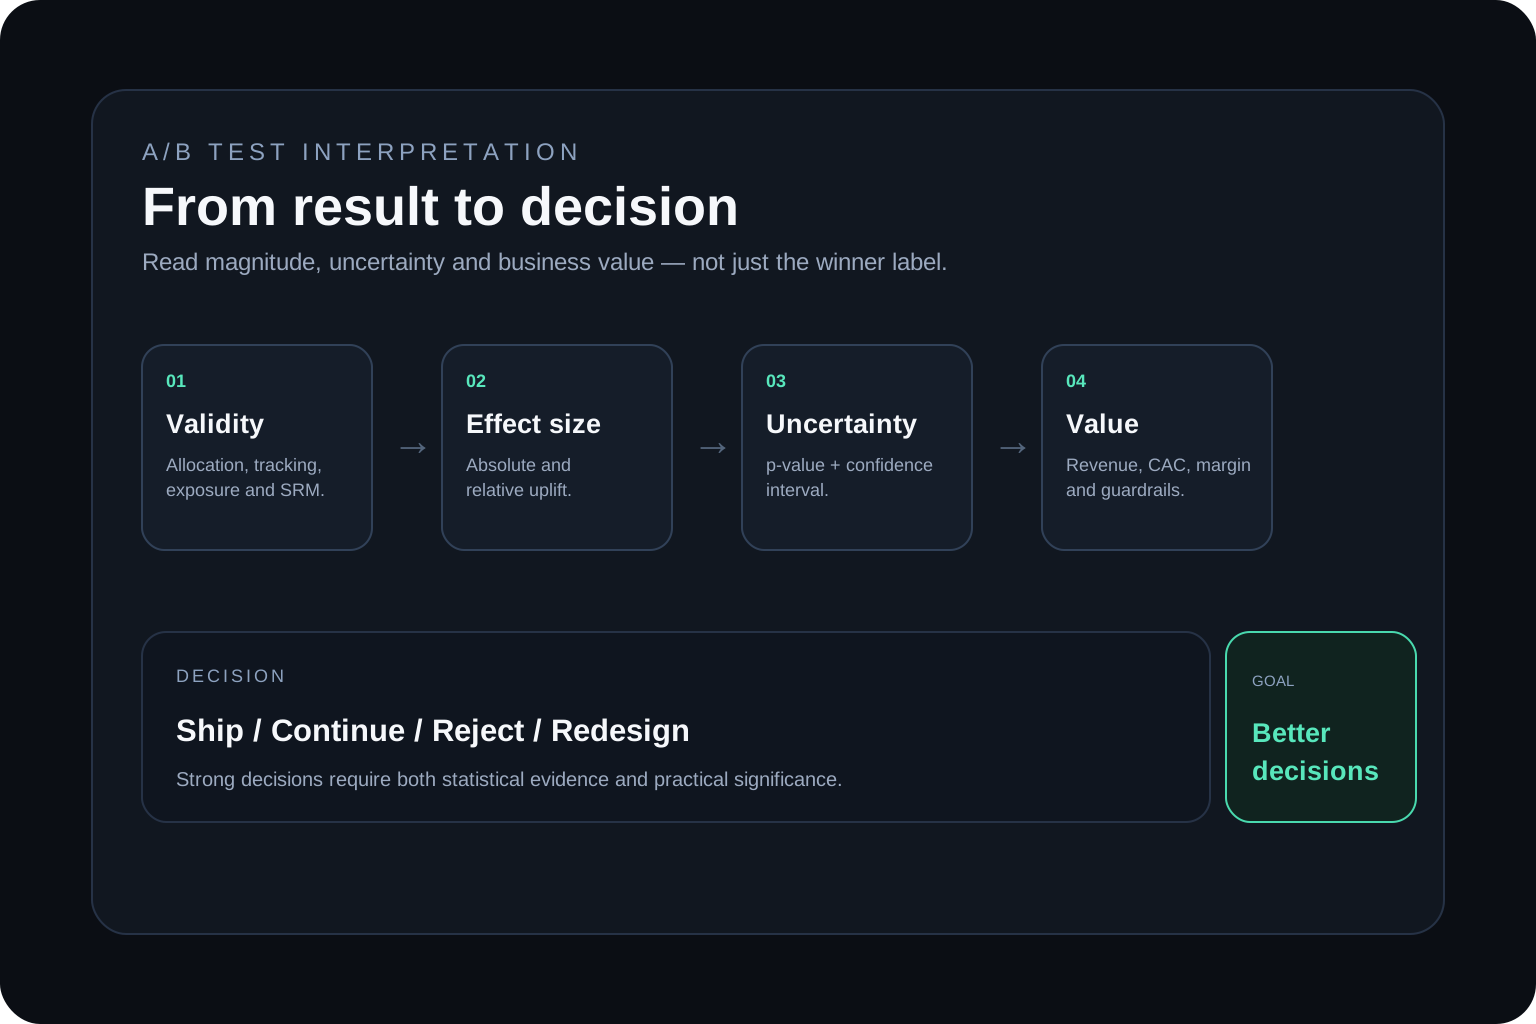
Read A/B test results in this order:
verify experiment quality and sample integrity;
compare the control and variant conversion rates;
calculate the absolute and relative effect;
check statistical evidence such as the p-value;
inspect the confidence interval around the effect;
judge whether the plausible effect is commercially meaningful;
ship, continue, reject or redesign the experiment.
Validate the experiment before reading the winner
A precise statistical calculation cannot repair a broken experiment. Before interpreting the result, verify that the data represents the test you intended to run.
At minimum, check:
Traffic allocation: users were assigned to control and variant as expected.
Sample ratio mismatch: an unexplained imbalance between groups can indicate assignment or tracking problems.
Exposure: users counted in a variant actually saw that variant.
Metric integrity: conversions were not duplicated, dropped or defined differently across variants.
Test stability: the design, targeting and primary metric did not change after the experiment started.
Stopping rule: the team did not simply stop at the first attractive result unless the method was explicitly designed for sequential monitoring.
If measurement itself is questionable, fix that before declaring a winner. The GA4 audit checklist is a useful starting point for event and conversion integrity.
Read the effect size before the p-value
Start with what actually changed. Suppose the control converts at 5.0% and the variant at 6.0%.
Example 1. The same result expressed in two ways
Swipe horizontally to view all columns →
Example 1. The same result expressed in two ways
Measure
Calculation
Result
Absolute uplift
6.0% − 5.0%
+1.0 percentage point
Relative uplift
(6.0% − 5.0%) / 5.0%
+20%
Both statements describe the same experiment, but they answer different questions. Absolute uplift is often easier to connect to incremental conversions. Relative uplift is useful for comparing proportional change against the baseline.
Always report which one you mean. Saying “conversion increased by 20%” when you actually mean “from 5% to 6%” can create unnecessary confusion.
What statistical significance actually means
In a conventional frequentist A/B test, the p-value asks how surprising the observed result—or a more extreme one—would be if the null hypothesis were true under the model and assumptions used.
A commonly used threshold is 0.05. If the p-value is below that threshold, teams often call the result statistically significant. But the correct interpretation is narrower than many dashboards imply.
A p-value below 0.05 does not mean:
there is a 95% probability that the variant is better;
the observed uplift is the true uplift;
the business impact is large;
the result will reproduce exactly in the future.
It means the observed data are difficult to reconcile with the null model at the chosen threshold, assuming the design and analysis are valid.
Why confidence intervals matter more than a binary winner
A binary label such as “significant” or “not significant” hides the most useful part of the result: the range of effect sizes that remain plausible under the statistical procedure.
Compare two hypothetical results:
Example 2. Similar point estimates, different uncertainty
Swipe horizontally to view all columns →
Example 2. Similar point estimates, different uncertainty
Experiment
Estimated uplift
95% confidence interval
Interpretation
A
+1.0 pp
+0.4 pp to +1.6 pp
Evidence is compatible with a consistently positive effect
B
+1.0 pp
−0.5 pp to +2.5 pp
The data still allow both harm and substantial upside
The point estimate is identical, but the decision quality is not. The second experiment is much less informative because the uncertainty is wider and crosses zero.
Confidence intervals are therefore useful for asking:
Could the true effect still be negative?
How large could the upside realistically be?
Is the lower bound still good enough to justify rollout?
Is the interval so wide that more evidence is needed?
Statistical significance vs practical significance
Statistical significance asks whether the data contain enough evidence to distinguish the observed effect from random variation under the chosen model. Practical significance asks whether the effect is large enough to matter to the business.
On a high-traffic product, an extremely small conversion-rate increase may become statistically significant. That does not automatically make it a good decision.
A useful business interpretation connects the experiment to economics:
incremental qualified leads or purchases;
incremental gross profit or contribution margin;
CAC or payback-period improvement;
activation, retention or customer-quality effects;
engineering and operational cost of rollout;
risk to downstream guardrail metrics.
What a non-significant result actually means
“Not statistically significant” does not mean “there is no effect.” It means the experiment did not produce strong enough evidence to reject the null at the chosen threshold.
A non-significant result can occur because:
the true effect is close to zero;
the true effect exists but the sample is too small;
the metric is too noisy;
the experiment was designed to detect an effect larger than the one that occurred;
Use the pre-defined stopping rule or a valid sequential method
Looking only at the winner
Ignores uncertainty and plausible downside
Read the confidence interval and effect size
Testing many metrics and reporting the best one
Multiple comparisons increase the chance of a lucky result
Pre-specify the primary metric and treat others as secondary evidence
Ignoring sample ratio mismatch
Can signal assignment, tracking or eligibility problems
Validate allocation before interpreting outcomes
Equating significance with business value
Tiny effects can be statistically significant at scale
Compare the effect with a commercial decision threshold
Worked example: from result to decision
Imagine a checkout experiment with 20,000 eligible visitors in each variant:
Control: 1,000 purchases — 5.0% conversion rate.
Variant: 1,120 purchases — 5.6% conversion rate.
The observed absolute uplift is +0.6 percentage points and the relative uplift is +12%. Suppose the statistical analysis shows evidence strong enough to clear the pre-defined threshold and a confidence interval that remains mostly above zero.
That is not yet the final decision. Next ask whether the effect is commercially valuable.
If every additional purchase contributes $40 of gross profit, an uplift of roughly 120 purchases over this traffic volume implies about $4,800 of incremental gross profit in the observed test window before implementation costs and any downstream effects.
Now the team can compare a statistical result with an economic decision: is the plausible ongoing contribution worth the rollout cost and any risk to refunds, margin, retention or customer quality?
Use the A/B Test Calculator to check significance and confidence intervals for your own control and variant data.
Positive and significant, but tiny business impact
Real-looking effect with weak economic value
Deprioritise unless rollout cost is negligible
Point estimate positive, interval crosses zero
Promising but uncertain
Continue only if the planned design allows it, or redesign a future test
Interval excludes meaningful upside
The variant is unlikely to produce the improvement the business needs
Reject or move to a stronger hypothesis
Tracking, allocation or SRM concerns
The experiment may be invalid regardless of the p-value
Do not interpret; fix the experiment and rerun if needed
The objective is not to maximise the number of “winning” tests. It is to make fewer bad decisions under uncertainty.
If experimentation is part of a broader conversion problem, Conversion Rate Optimization & Experimentation connects research, experiment design, measurement and interpretation to the commercial decision behind the test.
Frequently asked questions
What does statistical significance mean in A/B testing?
It means the observed data provide enough evidence, under the chosen statistical model and threshold, to reject the null hypothesis. It does not measure the size or business value of the effect.
What confidence level should I use for an A/B test?
Many teams use 95%, but the appropriate threshold depends on the cost of false positives, false negatives and the decision context. Choose it before seeing the result.
Can an A/B test be significant but not useful?
Yes. With enough traffic, very small effects can become statistically significant even when the incremental revenue or strategic value is too small to justify rollout.
Does a non-significant result mean there is no difference?
No. It means the experiment did not provide enough evidence to establish a difference at the chosen threshold. The confidence interval shows which effect sizes remain plausible.
Should I look at p-value or confidence interval first?
Start with the effect size, then inspect the confidence interval and use the p-value as supporting evidence. This keeps the interpretation focused on magnitude and uncertainty rather than a binary label.
When should I ship an A/B test winner?
When the experiment is valid, the evidence meets the pre-defined decision rule, the plausible effect is commercially meaningful, and important guardrail metrics do not show unacceptable harm.
Check significance, confidence intervals and effect size in the A/B Test Calculator, then decide whether the evidence is strong enough—and commercially meaningful enough—to act.
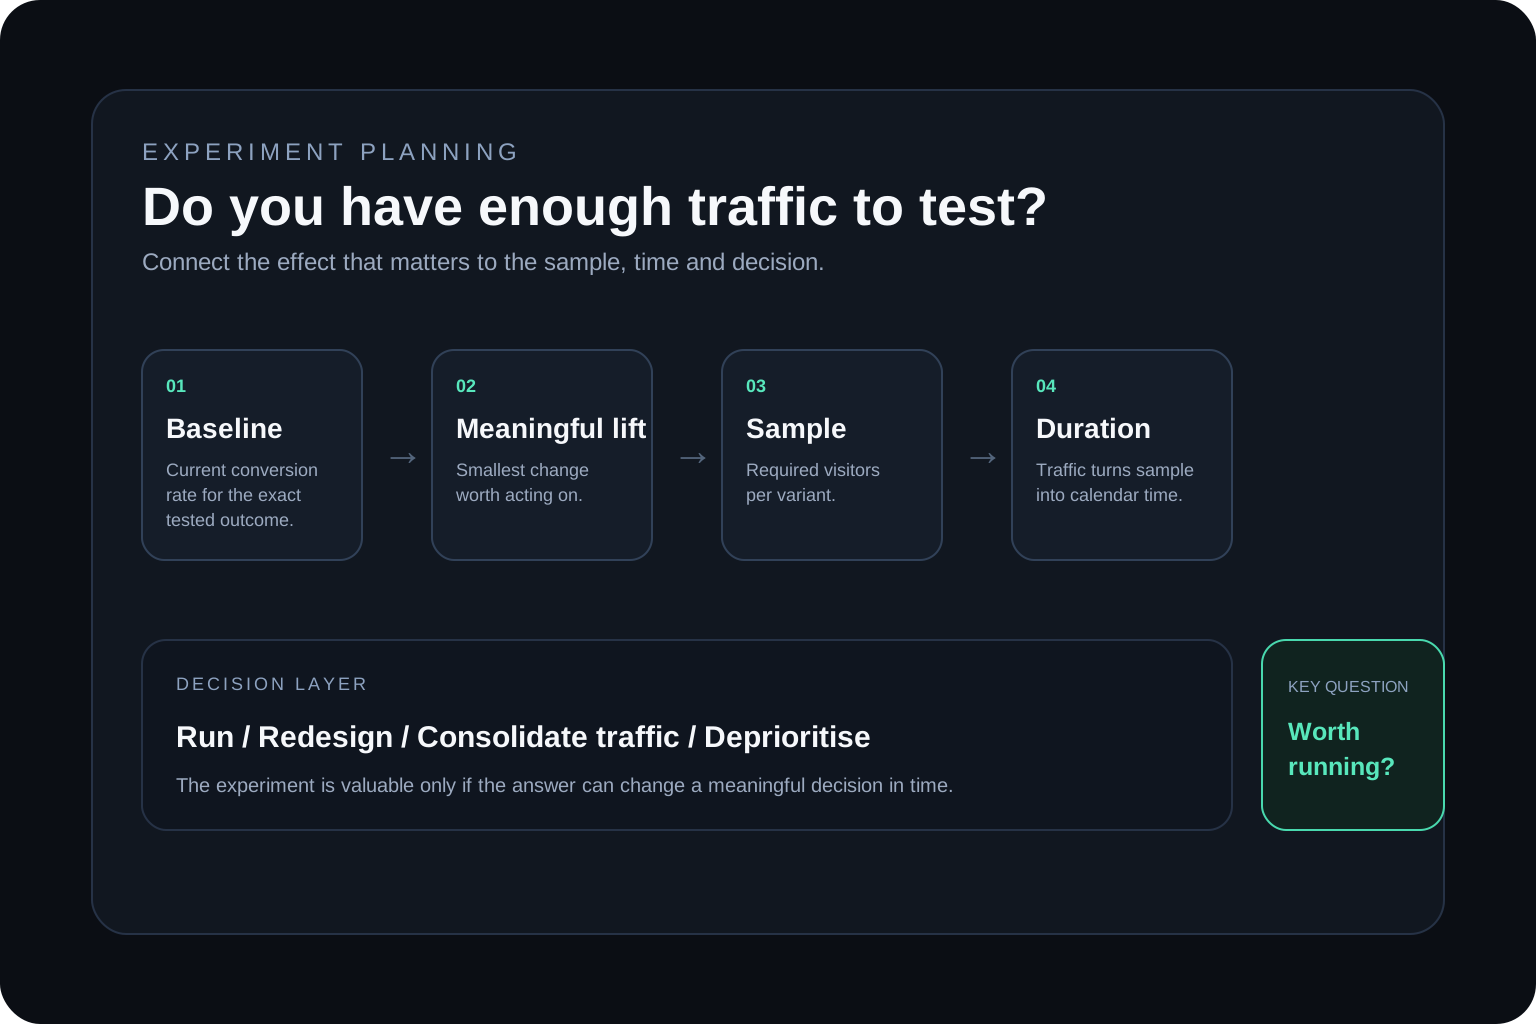
A practical decision framework for estimating A/B test sample size, test duration and whether your traffic is high enough to make the experiment worth running.
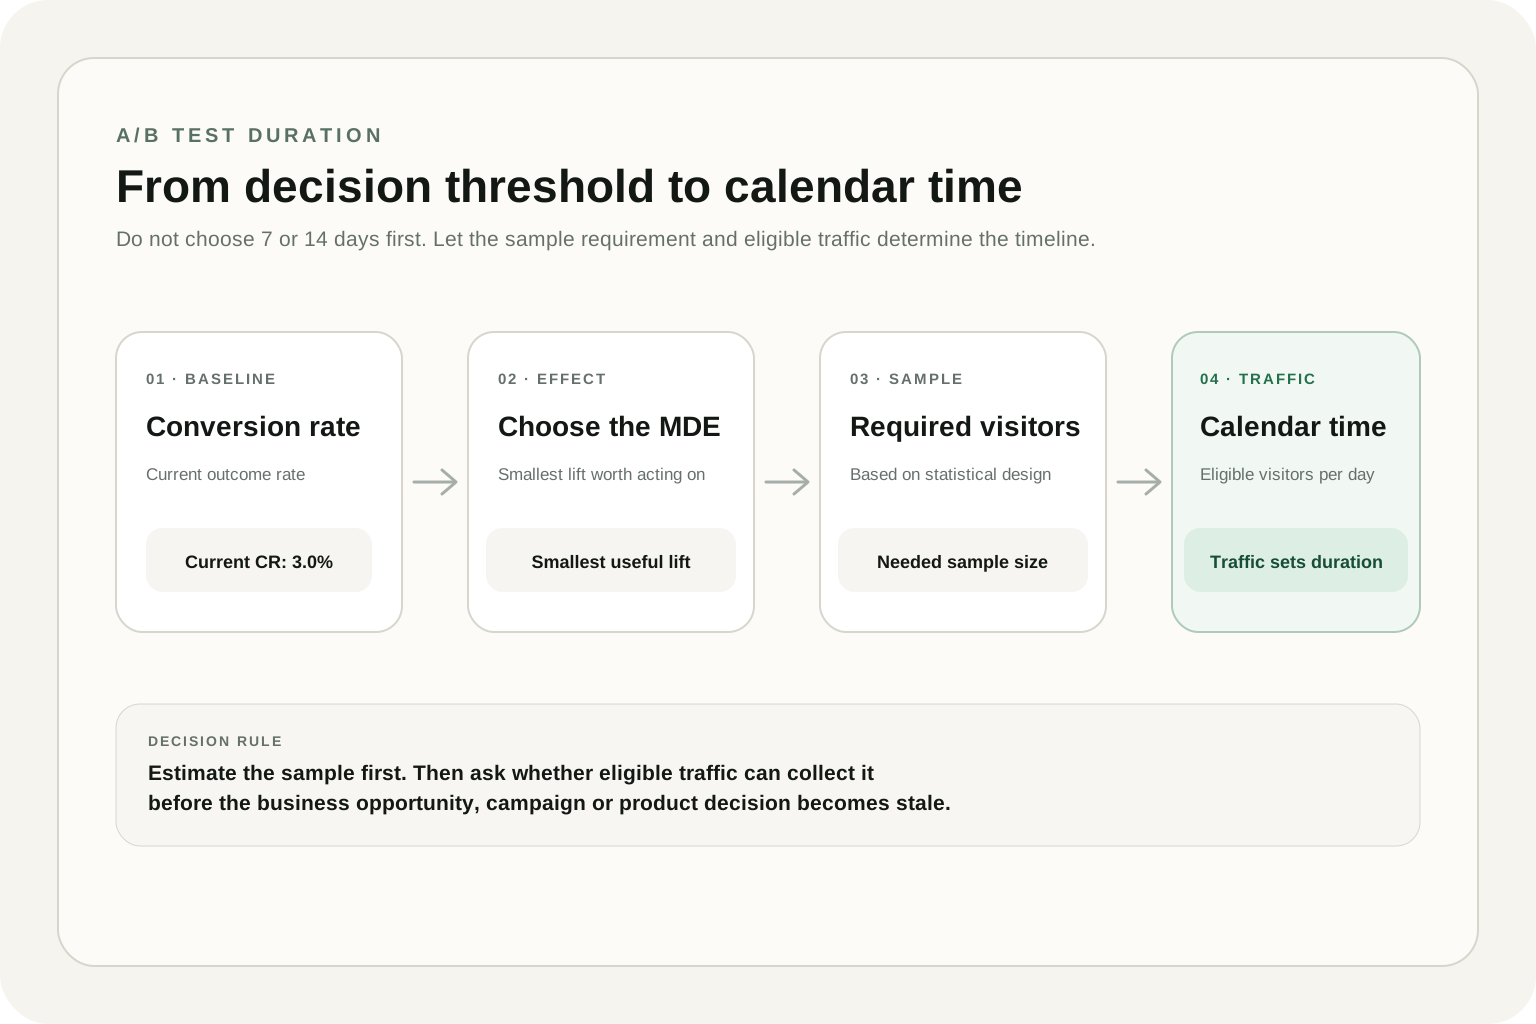
A practical guide to estimating A/B test duration from sample size, eligible traffic, baseline conversion rate and the smallest effect worth detecting.